September 2020: Leveraging Authentic Data Across STEM Curricula
Theme's playlist


Expert Panel

Leveraging Authentic Data Across STEM Curricula
Description: This month's panel explores the opportunities and challenges in incorporating authentic data into STEM classrooms.
This Theme of the Month Panel is a collaboration between the STEM for All Multiplex and the CADRE Resource Center.
Discussion
The Discussion related to Leveraging Authentic Data Across STEM Curricula is now live! Introduce yourself and let us know your interest in exploring this theme. This discussion will continue through October.Related Resources
This Spotlight features 16 DRK-12 projects that are building students' data skills through research and innovative curriculum and tools.
Data Clubs believes that middle school learners can and should know how to interpret data to make decisions and manipulate data to answer their own questions. Three modules engage them with “big” data—large data sets collected by government agencies, research institutes and international collaborations—curated by the Data Clubs team.
Here is the link to the special issue "Situating Data Science: Exploring How Relationships to Data Shape Learning," of this publication: https://www.tandfonline.com/toc/hlns20/29/1?nav=tocList
The writings and resources (free access) here offer core ideas, observations, strategies, and reflections about practical challenges to teaching students how to turn data into evidence, understanding, and, ultimately, into justifiable decisions, and wise action.
CODAP is free educational software for data analysis. This web-based data science tool is designed as a platform for developers and as an application for students in grades 6-14.
This set of dynamic data science activities is designed for grades 9-14. All dynamic data science activities are embedded in our Common Online Data Analysis Platform (CODAP) software.
The 'Designing 2030' meeting (January 2019) catalyzed a group of education leaders to advance the conversation on how to achieve data fluency and support data science education for all. This report is a synthesis of the discussions that took place at that meeting.
In this article, the authors describe opportunities for authentic data inquiry and project based learning experiences that integrate real world questions and large data sets, using harmful algal blooms as an example.
In this paper, we argue that paying explicit attention to data moves, as well as their purposes and consequences, is necessary for educators to support student learning about data. This is especially needed in an era when students are expected to develop critical literacy around data and engage in purposeful, self-directed exploration of large and often complex datasets.
This book leads you through a few introductory lessons in data science. You can think of it as a self-guided textbook for teachers or students. If you’re a teacher, you might assign chapters, problems, or projects for students to read and do. (You will use CODAP, a free web-based software - see resource above.)
This paper contributes a theoretical framework informed by historical, philosophical and ethnographic studies of science practice to argue that data should be considered to be actively produced, rather than passively collected.
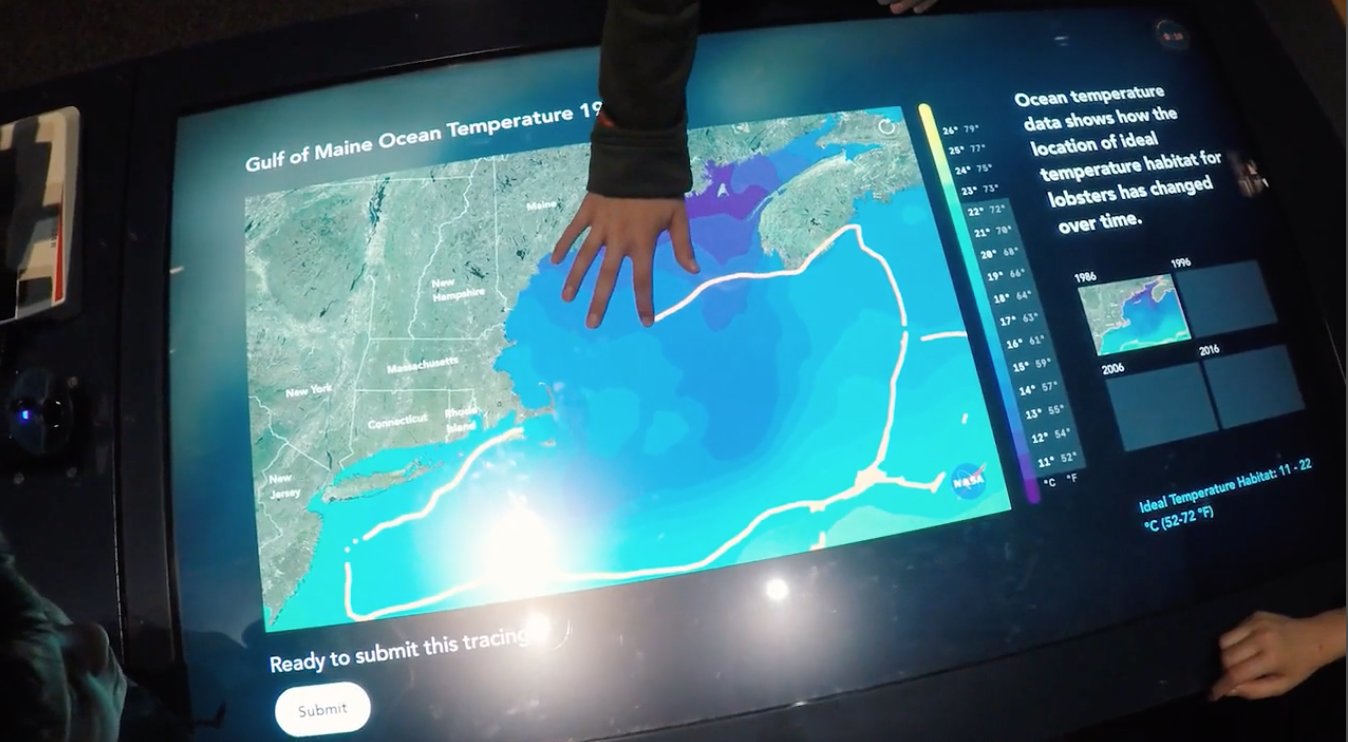
Real World, Real Science provides 4 free learning modules (more coming soon) that use authentic NASA and NOAA data to study the effects of the Earth’s changing climate on the animals and plants of Maine’s diverse habitats.
This curriculum guides students (high school and undergraduate levels) through an exploration of data using the Ocean Tracks interface.
Zoom In! is a free, Web-based platform that helps students build their data literacy through “deep dives” into real-world science problems using authentic data sets with topics in earth science and biology.
EDC’s Oceans of Data Institute (ODI) convened an expert panel of both data analysts and educators for a workshop on data literacy. This report captures the takeaways from that 3-day workshop.
In April 2016, a panel of Big Data experts identified the big data skills, knowledge and behaviors of a "Data Practitioner" that are needed in the workplace. This profile will be used by ODI and its community college partners to design and build course and programs leading to big data careers.
Traci Higgins
Hi all. This is Traci Higgins, affiliated with TERC (in Cambridge, MA), where I have been working with Andee Rubin and team on the Data Clubs project. I'm particularly interested in the question of how students approach and use data especially when interacting with big messy data or multivariate datasets that have been collected and made available by others. What are students initially drawn to in these data sets, what sorts of questions do they think can be answered by data, how do their ideas change as they gain experience using technology to explore such data?
Josephine Louie
Hi all -- This is an exciting topic and theme for the month. I'm Jo Louie, at EDC, leading two projects to promote students' statistical reasoning and data practices. In one project, Strengthening Data Literacy across the Curriculum (SDLC), we're targeting students in non-AP math/statistics classes with data investigations that explore social justice topics using American Community Survey and U.S. Census data. We have an explicit goal to promote multivariable thinking in this project, which we define as the ability to attend to interaction effects (and awareness of Simpson's paradox) when dealing with more than two variables. We've found that when high school students are thinking about data with a meaningful and relatable context, multivariable thinking seems to come up quite naturally. For example, one of our topics is income inequality and the male-female wage gap. They naturally generate ideas of other variables that might explain the gap (e.g., part-time vs. full-time work, marital status, type of occupations entered). Tools that Bill Finzer has created in CODAP (such as a third variable "splitting function") allow students to explore interaction effects visually, which really helps.
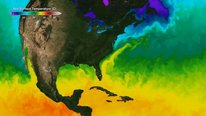
In our other project, WeatherX, we are working with rural middle school students and examining extreme weather events using NOAA data and data collected by the Mount Washington Observatory in NH. Storms and extreme weather events are highly multivariable, and the relationships among variables are very complex. We are in the early stages of this project, and working with a slightly younger group of students, so it remains to be seen how far we can go in having students make meaning from associations of data with complex interrelationships, and with variables that may be a little more abstract (e.g., air pressure, wind speed).
CADRE Team
Thanks Traci. Those are great questions. We at CADRE, a network for a PreK-12 research funding program at National Science Foundation, were excited to organize September’s Theme of the Month around Leveraging Authentic Data Across STEM Curricula. We have seen a growing number of NSF-funded projects focused on developing students’ data skills across disciplines and think this is a timely topic. We have a few additional questions for our different audiences. Educators: How are you incorporating data into your classrooms? Researchers: What are some of the challenges you’ve faced in integrating data into curriculum and professional development? Where have you seen the most exciting successes? All: What questions do you have for our webinar’s expert panel?
Jacob Sagrans
I just watched the recording of this great panel from yesterday. Thank you!
Since I wasn't able to attend live yesterday to ask questions in the live chat, I'll post here.
I work with Traci and Andee on the Data Clubs project. We've recently begun having middle school youth explore COVID-19 data and have incorporated discussion about how to do this into our teacher professional development work. We've used CODAP a lot in Data Clubs. I think is a really great tool for getting youth exploring data, because it's intuitive, accessible, customizable, and interactive.
One thing I'm thinking about now, though, that I hadn't been thinking about as much before the pandemic is how to explore data on maps. The spread of a disease like COVID-19 has a geographical component. I would love to get youth and teachers exploring COVID-19 data on maps, ideally in a way that also is highly accessible and interactive, like CODAP is when it comes to making tables and graphs (a lot of the COVID maps I've seen so far have been static images, or not very accessible).
I'm curious if any of the panelists or other people who attended or are watching the recording now have experience with guiding youth in exploring data on maps. What have you done? What worked well? What tools/maps/data sets have you used? Have any of you done this with COVID-19 data?
Thanks!
Jessica Sickler
The Ocean Tracks project was all about engaging students (HS and college) in geospatial data, including tracking data from several marine species and oceanographic data (sea surface temp, net productivity, etc.). The team created an online interface for interacting with the data and instructional modules to scaffold learning, so you can get a sense of how they approached the task. https://oceantracks.org/ (And a shout out to Randy Kochevar and Jo Louie, both of whom were part of Ocean Tracks, and may be able to add more.)
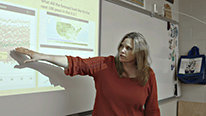
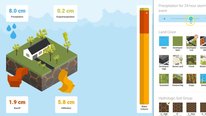
In our ongoing Streams of Data project, we’ve been doing some baseline research with students in grades 3-5 to see what skills they naturally bring to interpreting data representations – one of which was a map of 7-day rainfall in the US. One of my takeaways is that maps offer a very familiar starting point, but that comfort is deceptive, because map-based data often contains really complex information and nuance. We had a number of young students confidently assert that the map was easy to understand, even when they had clearly not understood what it was showing. And others who realized their struggles, essentially noting how information-dense it was: “Every single piece of the country is a different color… I think we could get rid of some of the colors.” Which I think pointed to the importance of supports to scaffold a process of how you look at and reason through map-based data (something Ocean Tracks does quite well, I think).
Jacob Sagrans
Susan Meabh Kelly
As additional response to the query of Jacob Sagrans, there is a history of NASA- and NSF-funded efforts to support K-12 students' and teachers' use of geospatial data. Examples that foremost come to mind include NASA-funded Eyes in the Sky II (2010) in which Randy Kochevar, Oceans of Data, had contributed (https://serc.carleton.edu/eyesinthesky2/index.html) and Alec Bodzin's long-standing commitment to supporting classroom integration of geospatial data (https://cadrek12.org/users/alec-bodzin: https://ed.lehigh.edu/faculty/directory/abodzin).
Last week I had a virtual meeting with two of the high school teachers Alec Bodzin has been collaborating with (Shannon Salter (Allentown, PA) and Ian Hanson (Wilmington, DE)) and learned that they had facilitated student COVID-19 data investigations (number of cases/allocation of funds) "on the fly" as a result of their past experience in Alec Bodzin's environmental GIS projects. There is much to be learned from teachers as to their use and foreseen potential for geospatial models, as well as principal investigators with long-standing commitment to facilitating K-12 construction and meaningful use of locally relevant geospatial models.
Jacob Sagrans
Jacob Sagrans
Thank you for these very helpful responses! I will check out these resources.
BEVERLY SIMMONS
HI, the InterNational STEM League Competitions and our Ten80 classes/camps have been working with DDD MODS (Data-Driven Design and Data-Driven Decisions Modules) for the past decade. Some of our students have gone from middle grades all the way to graduation. We have collected data on both rural and inner-city youth that are traditionally underrepresented in STEM courses and careers. We were one of the four Change the Equation endorsed programs as Exemplary and Scalable. The most difficult challenge we faced was getting students to see data as predictive rather than explanatory. In their formal education, they are required to interpret what happened by reading a graph or creating a graph from some data set. That is very different from what they will need to do as an engineer visiting a limestone kiln in rural AZ in which limestone rocks are put in the 14 story kiln, but the lime that comes out the other end has a chemical composition that renders it useless to the customer. What skills will be needed by the engineer who is called into a plant creating building blocks that are "suddenly" exhibiting small cracks? When our engineering team faced these kinds of issues, we were usually called in when on-site teams had not solved the problem so there was often a critical time constraint. The one thing I heard about our team was that "they can tell more stories from data than anybody we have ever seen." It is a subtle difference but an important one. Storytelling from data also means you can see the data that is missing and find a way to collect it to complete the story. Starting with problems that can be seen, touched, and affected is important as the first step toward DDD. Students must build a mindset that lets them trust their work with data, trust its predictive power, and trust the story they will weave with more complex issues such as climate change.