


- Anna Amato
- PhD Student
- Presenter’s NSFRESOURCECENTERS
- New York University
- Kayla DesPortes
- https://www.kayladesportes.com/
- Assistant Professor of HCI & the Learning Sciences
- Presenter’s NSFRESOURCECENTERS
- New York University
- Camillia Matuk
- https://steinhardt.nyu.edu/people/camillia-matuk
- Assistant Professor
- Presenter’s NSFRESOURCECENTERS
- New York University
- Megan Silander
- http://cct.edc.org/people/silander-megan
- Research Scientist
- Presenter’s NSFRESOURCECENTERS
- Education Development Center (EDC)
- Marian Tes
- Doctoral Student
- Presenter’s NSFRESOURCECENTERS
- New York University
- Ralph Vacca
- Assistant Professor
- Presenter’s NSFRESOURCECENTERS
- Fordham University
- Peter Woods
- Research Scientist
- Presenter’s NSFRESOURCECENTERS
- Massachusetts Institute of Technology
Building Data Literacy Through the Arts
NSF Awards: 1908557, 1908142, 1908030
2022 (see original presentation & discussion)
Grades 6-8
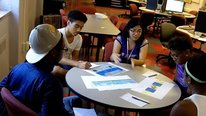
This video highlights the challenges and opportunities of co-designing and implementing interdisciplinary, arts-based data literacy curriculums in middle school classrooms. Data science draws on practices from multiple disciplines to support new ways of knowing. Yet, the arts have traditionally served only as a means to widen engagement with STEM (Science, Technology, Engineering, Mathematics) literacies. Researchers in data literacy are increasingly recognizing the need to situate data inquiry in personally and socially meaningful contexts. In Building Data Literacy Through the Arts, we ask: (1) How does an art-based approach support students' data literacy? (2) How do we support effective co-design of data literacy units among art teachers, mathematics teachers, and researchers? And (3) How are teachers able to use the unit materials in their classrooms to engage students in data literacy? We report on the codesign and implementation of four interdisciplinary units which engage students with data about friendships through comic-making, data about healthy neighborhoods and time use through photography, and data about gender inequities through dance. In this video, we share our findings about how to support interdisciplinary curriculum collaborations and the opportunities and challenges of various arts-based pedagogical approaches and tools for data literacy.
Related Content for Building Data Literacy Through the Arts
-
 2016STEM Literacy through Infographics
Cynthia Graville
-
 2019We are the A in STEAM
Robert Reardon
-
 2017What's This? Just Listen : The Sound of Silence
Erin Ottmar
-
 2020Arts-focused STEM learning: Blending science, coding, & art
Megan McKinley-Hicks
-
 2020Interpreting Hurricane Florence
Robert Reardon
-
 2022Earth SySTEM: Using Satellites to Monitor the Earth
John Moore
-
 2022A pathway to technology literacy through art creation
Raffaella Borasi
-
 2017Full Steam Ahead: PD Model for Best Practices in STEAM
Kristin Cook
Camillia Matuk
Assistant Professor
Welcome to our video! Our collaborative project is an effort to co-design arts-integrated data literacy curriculum with middle school math and arts teachers (i.e., visual art, English Language Arts, dance).
With just a few months remaining, we're working on making our curriculum units available on our project website, and actively plotting the project's next steps.
We'll look forward to your thoughts and feedback!
Josephine Louie
Hi Camillia and all--
Thanks so much for your exciting work. Can you share how you've been assessing student growth and engagement in data literacy from your arts-based approach? What aspects of data literacy would you say an arts-focused emphasis has the most potential to support? How have students responded in terms of engaging with data in the future?
Anna Amato
PhD Student
Hi Josephine, thanks for your questions! Each of our school-contexts are slightly different, but we have been assessing student growth and engagement through pre and post surveys, interviews, and student artifacts. For example, looking at their ideas about what counts as data, how data is produced and used, competencies in interpreting graphs like scatterplots and dot plots/histograms. We also look closely at how students draw on the arts to make inferences based on data, going beyond just reading the data--making comparisons, hypotheses, explanations, thinking about their personal or local contexts and implications for people and communities. Many of these learning goals fit with the goals of critical data literacy.
Josephine Louie
Thanks for your response, Anna. You're examining a rich set of student outcome measures and responses to your curriculum -- I look forward to learning from your findings!
Ambika Silva
What a fun way to get students interested in data!!! What have you found on students' interest in going into a data/statistics field before/after this program?
Anna Amato
PhD Student
We work with middle school students right now so it's hard to say how it might impact their future career paths, but we have found students excited to analyze data to investigate their communities, think about their own friendships, and highlight social issues they care about.
Tichina Ward-Pratt
Educator
Hi you all, this is an excellent project and excited about what it means for the schools that you all work with.
In the video, it was stated that "we wanted students to see data as more than just numbers to be calculated, but to also see the social context behind those numbers." Considering the culture around math, that can be exclusive and intimidating, leaving students to believe that they are "not a math person," how can your project not further isolate students from math with the assumption that math is only numbers and cannot be taught within a social context? This is especially important for students of color and young women going into STEM.
Anna Amato
PhD Student
Great question! We emphasize the connections and integration that is possible between art and math. These disciplines are often siloed in school contexts, with art offering spaces for social commentary and debate and math being seen as a technique for producing right answers. Producing and using data for personal or socially meaningful purposes can not only expand ideas about what math is and how it might be useful to everyday life or for creative construction, but can also can engage students in asking statistical questions and reflecting on variation and uncertainty. These are entry points for engaging critically with their local contexts through the lens of data.
Joan Ferrini-Mundy
University President
Very creative and interesting project. I'm interested in hearing more about your comment that socio-emotional literacy developed along with data literacy - related to the earlier questions about assessment and outcomes. And, though it may be early in the project, would like to hear your thinking about how this innovative curricular approach might, after some continued assessment and related refinement, be scaled and adapted in a wide range of school settings, and what the prospects are for integration into the data, or mathematics, or arts curricula?
Peter Woods
Research Scientist
Oops! Posted my reply in the wrong spot. See my comments below.
Corinne Brenner
Hi everyone, I love this project! What kind of support for, or buy-in from, administrators or teachers do you think would be needed to break down some of the siloes you mentioned?
Anna Amato
PhD Student
The main way we are investigating this question is through enacting a codesign process to develop a curriculum (between researchers, math, art, ELA teachers). One trajectory we have observed is for educators to move from only planning activities in their own discipline, to trying out the tools of other disciplines, or even teaching ideas from other disciplines with support. Teachers may not feel confident teaching about data or art if it is outside of their expertise or may not see the integration as fundamental for learning in their discipline. Part of codesign is building this confidence and discovery of how art and data literacy can reinforce goals in both disciplines through creative construction, iteration, and discussion. The scope and sequence of the curriculum will be different for each school depending on their goals and time.
Peter Woods
Research Scientist
Thank you for your questions! To start with your first question, a lot of the assessment for socio-emotional learning we have been doing on the research side of things comes from the data collection we have been doing (pre/post surveys, interviews, artifact analysis, observations, etc.). We haven't really been exploring teacher or school-based assessments of students' SEL, but could be an excellent next step in the project. IN terms of the kinds of SEL we saw, we found evidence of students developing self-awareness, social-awareness, relationship skills, empathy, ability to communicate emotions, and other aspects of SEL across the projects. If you want to see a more detailed slice of this work, we recently presented a paper at the CHI Conference on Human Factors in Computing Systems that you can read here.
As for your comment about scaling, we often run into a tension between scaling a project up and honoring the contextual and place-based aspects of our curricula in this kind of work. So much of this curricula is rooted in the interests of the students and the skills of the teachers that being able to scale these things can be a tricky balancing act (and doing it with the same data or materials feels nearly impossible). That said, I think this work provides something of a framework that can help teachers develop these kinds of projects in schools. For instance, understanding the kinds of mathematics supports students need may be a universal that can then support teachers and students co-designing arts-based inquiries into their immediate context.
All of that to say: it's an interesting design challenge and one we're continuing to think about.
Patrik Lundh
A really interesting and inspiring project! I'm curious about what insight you have into students' experiences with these activities. Did you interview students or collect any other data to provide insight into how they engaged cognitively and emotionally?
Peter Woods
Research Scientist
Thanks for the question! We were very interested in the student experience as well, so we conducted interviews with students after the projects wrapped up and also collected/analyzed artifacts from them as well.
And what we found was pretty broad, both in terms of developing data literacy knowledge/skills and socioemotional learning. So rather than try to summarize everything I'll point you to a few conference papers we have available. Lots more publications coming in the near future as well!
https://www.researchgate.net/publication/359196151_I_happen_to_be_one_of_478_Social-Emotional_and_Data_Reasoning_in_Middle_School_Students'_Comics_about_Friendship
https://www.researchgate.net/publication/360001008_What_Do_You_Meme_Students_Communicating_their_Experiences_Intuitions_and_Biases_Surrounding_Data_Through_Memes
https://www.researchgate.net/publication/359821240_Dancing_with_Data_Embodying_the_Numerical_and_Humanistic_Sides_of_Data
https://www.researchgate.net/publication/359196152_Postcards_and_photo_walks_Telling_community_data_stories_through_photography
Let me know if you have trouble accessing any of these.
Jessica Young
Very interesting project! I was wondering if your research has shown any differences for students who engage in this arts-integrated approach versus another approach--for example if students are better able to interpret complex graphs and data displays after they have engaged in the arts-integrated curriculum? Or if students gain new understandings about communication? Using dance to communicate about their findings is such a cool idea! I'd be really interested to hear what students thought about it and what insights they felt they had gained.
Peter Woods
Research Scientist
Great question! So I'm not familiar with many studies that do a side by side comparison of arts-based and more traditional approaches to data science education that might speak to your question (if anyone else on the project wants to jump in with any, please do!), but what we are finding with our own research is that a lot of the humanistic elements of data science education described by Lee & Wilkerson come out through an arts-based approach approach: understanding how the data speaks to contexts, interpreting the data/applying it to real world situations, seeing oneself in the data, raising questions based on data interpretations, etc. If you want to read more about data art in data science education, I recommend tracking down the work of Rahul Bhargava, Catherine D'Ignazio, and Amy Stornaiuolo. All of them have done great work on this front.
As for what we found when it comes to dance-based data science curricula, you can find a recent conference paper from us on that topic here.
Joi Spencer
Interim Dean and Professor of Mathematics Education
I was so excited to see the arts here as a conduit for STEM (data) literacy. In my own work, my colleagues and I integrate a wide range of art forms into the teaching of mathematics and STEM. I am wondering if the schools that you worked with already had arts education programs. I noticed the students dancing, for example. Was this already a part of their school's curriculum/course offerings? Were there any schools that you wanted to work with, but they did not have arts programming? Also, did students have choice in the kind of art they brought to the data-learning experience? Were some mediums of art better at facilitating the understanding of the data being explored than others?
Anna Amato
PhD Student
The schools we worked with formed a spectrum of how we were able to draw on arts education programs. The dance implementation was done in a context that had previous experience doing arts-integrated interdisciplinary projects (although data was new for them) and they had a dance teacher. Two others had a general arts courses that met once a week or so and one did not have a dedicated arts teacher so we drew on ELA for a kind of digital media arts focus. We selected the medium for the students through codesign with the teachers but one reason is that we wanted to support specific goals in art that may be different for illustration, visual storytelling, photography, dance, etc. The art mediums offered different ways of engaging with data. For example, in dance students embodied mathematical trends seen in graphical displays and offered space for interpretation through emotion. In comic-making students were given space to reflect on what statistics about friendship meant in their own lives and experiences, finding that personal connection to data. Photography helped students see connections between community data and what they see in their local neighborhoods and everyday routines. Photography offers space to communicate about social issues through both quantitative and qualitative data, to think about data in context, and visualize comparisons, patterns, associations.
Karen Royer
I am fascinated with your work. I am curious about areas that you found were impediments for the students integrating art and math. How did the inequality of access to art and math instruction impact the students? Thanks for your video
Anna Amato
PhD Student
I would say there is a spectrum of how students were tasked with integrating art and data. One of the big impediments is just having more time to iterate on projects, respond to feedback or dig deeper into topics & questions they discover. In one school, access to computers became an issue and they also had to contend with unexpected interruptions due to testing. In photography, not all students were able to photograph their local neighborhoods the way they wanted to due to various impediments but could only take photos on the class-organized walks. In some contexts art is only once a week so being able to prioritize both art and math equally requires more time (e.g., 5 weeks vs. 2 weeks). It is also challenging to engage students in transforming large data sets if they don't have access to computers or even building new routines with data analysis tools is challenging to introduce for one unit.
Leah Rosenbaum
Thank you so much for this work and for the beautiful video sharing it! In a response above, you mention assessing student growth through the artifacts they produce, among other resources. I realize it likely varies by medium, but could you say a a bit more about how you study these artifacts and infer student growth or learning from them?
For context, I'm part of a team working on fostering modeling and data use (our Showcase video is here). Along with real-world data and computer simulations, we ask students to draw models of the scientific phenomena under study. Students' drawn models can be wonderfully rich, expressive, and surprising, and I'm curious about ways to honor all the work they put into them.
Peter Woods
Research Scientist
Thanks for the question! The main way we approach this aspect of the work is through coding the artifacts in different ways. Much like a teacher might use a rubric, we look for evidence of different components of data reasoning/literacy/science that students have included in the piece they produced. In coding the students comics, for instance, we looked for evidence of students engaging in different kinds of data reasoning: Descriptive Data Reasoning, Contextualizing the Data, Describing an Individual Experience in Relation to Data, Proportional Comparisons, Drawing Implications From the Data, and Listing further inquiries into the data (definitions and further analyses can be found in our paper here).
To measure learning, we've employed a few approaches along the ways with pre/post surveys and interviews being the most frequent tools we've used. This gives us a pretty holistic picture of what students learned in these units.
Leah Rosenbaum
Thanks so much for these details and for the link to your paper - definitely helpful in thinking about what we can learn from students' expressive artifacts!
Dorothy Bennett
This project is very interesting and thank you for sharing! I find that data literacy through photography is intriguing and compelling. Often photography is not thought of as a tool for documentation and data collection but the possibilities are vast. Wondering if you could talk more about how you supported kids in analyzing and using their photographs and what kinds of skills and big ideas were they bumping up against? Also what subject area teachers have you had the most success with given the challenges to interdisciplinary work in our educational system?
And an aside: In our own work at NYSCI, we created a suite of what we call Noticing Tools that allow kids to make math and science discoveries through compelling digital design projects. One is called Choreo graph, where children can take still photographs, dissect pieces, and use coordinate grids and angles of rotations to animate these pieces to make an animation. Many of our activities focused on making a dance routine using themselves or their favorite characters as the stars of their performances. Would love to follow up more with you to see what you think about these! Seems like there might be interesting for collaboration.
In terms of interdisciplinary work: We found that the art teachers did some of the deepest explorations with our tools, such as using our digital caliper tools to measure the distance and relationships of things in their photographs in order to create forced perspective photos that were effective (aka holding up the leaning tower of PISA). Another in our app Size Wise students were doing experiments investigating at what distance hue changes (I love that question!). These scenes and activities are ripe for a data literacy lens and I think are a result of the fact that art teachers emphasis is on teaching ways of seeing.
Anyway, would love to get more information about your work.
Anna Amato
PhD Student
Hi, thanks for your questions. Students reflected on their photos in terms of how they might tell a data story. For example, how do they help answer a statistical question and situate data in a local context (including setting the scene, showing a patter, contrast, or association, and representing the potential impact on people and places). They also reflected on composition strategies and how they used them to tell a story or express an emotion or idea. The focus on student inquiry prompted students to wrestle not only with challenges of getting out in their neighborhood to take photos, but coming up with investigative questions, thinking about how data they investigated might complement or support their photo essays, and rethinking inferences/perspectives based on what they saw in their local neighborhoods. The tools you mention sound really interesting, especially if we had a little more time for this project or students did an extension. I'll take a look at them. We would love to follow-up with you and think more about how we might collaborate.
Raffaella Borasi
I love the focus of your project on integrating arts and data science - I think the examples you showcased are quite powerful illustrations of what is possible, and how art can be used as a means to learn STEM.
It well complement our project's approach, as we also connected arts and technology, but focusing instead on how technology can support art creation - as a way to motivate students to learn technology (among other things).
I'd like to learn more about the co-design process between arts and STEM teachers, as I believe we can benefit from your "lessons learned" as we go to the next phase of our project.
Peter Woods
Research Scientist
Thanks for your question! And you're right, we definitely learned about co-designing interdisciplinary projects through this work!
Personally, I think the most important takeaway that we have landed on so far is that context matters in a big way. Student interests, school culture, administrative support, type or school, art forms, teacher backgrounds, data science education experience and focus, all of this plays into the success of the project and changes from school to school (and, in some cases, classroom to classroom). To this end, it was really important for us as researchers and co-designers to build in structures that had enough flexibility for teachers and students of all backgrounds to fit and grow within while also centering the goals we had as researchers and educators. I'm thinking here with Barab et al. (2004) when they talk about social commitments: decided up front what we, as co-designers want to hold to without dominating the conversation or overpowering the contextual nature of this work.
One other important lesson learned: be ready to support in a variety of ways. As we've been thinking through our process so far, we've spent a lot of time thinking about the roles of everyone involved. From the researcher side alone, we've at times been designers, advocates, data analysts, artists, students, teachers, and so many other things. And whenever we have taken on one of these roles, it's in support of the teachers implementing this work. Because the co-design process is so contextual, the supports teachers need have varied between schools and also changed as the project has grown. So we've been flexible and attentive, doing our best to help the teachers as they have implemented these projects.
Cheryl Craig
Strong interdisciplinary approach. The approach intensifies learning.
Further posting is closed as the event has ended.