


- Erin Ottmar
- https://sites.google.com/site/erinottmar/
- Assistant Professor of Learning Sciences and Technology
- Presenter’s NSFRESOURCECENTERS
- Worcester Polytechnic Institute
- V.J. Manzo
- http://www.vjmanzo.com
- Assistant Professor of Music Technology
- Presenter’s NSFRESOURCECENTERS
- Worcester Polytechnic Institute
- Michael Timko
- https://www.wpi.edu/people/faculty/mttimko
- Assistant Professsor
- Presenter’s NSFRESOURCECENTERS
- Worcester Polytechnic Institute
What's This? Just Listen: Using Sonification to Reveal Hidden Scientific Data
NSF Awards: 1342320
2017 (see original presentation & discussion)
Grades K-6, Grades 6-8, Grades 9-12, Undergraduate, Graduate, Adult learners, Informal / multi-age
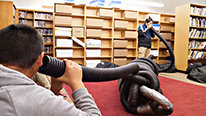
We are constantly surrounded by invisible things. Though we can see objects, hear sounds, and touch matter, our senses are limited in what they can reveal. What lies beyond surface-level features can be difficult to conceptualize without proper technology that can uncover the invisible and abstract structures. This video What’s This? Just Listen! introduces a new technology genre of sonified instruction that provides an engaging learning experience that not only allows students to realize the abstractness of the “invisible”, by directly mapping auditory and visual representations of data generated from real world objects, while listening to sonified music of those representations in real time. We use sonification to map abstract and visual patterns and structures of data into musical motives and forms that correlate to context-specific trends and patterns within the observed data. Data representing the chemical composition of everyday objects will be the focus of this video. Raman spectrometry can show us that everyday objects are made out of different combinations of molecules and atoms. In this video, we will demonstrate how we can literally hear the molecular structure of cellulose and other objects as a musical composition. Our framework for this project is deeply rooted in research building on embodied cognition, multimodal learning theory, and science education with interdisciplinary elements that draw from music and arts-infused education.We aim to equip the education and research communities with a novel pedagogical tool that exposes abstract STEM concepts to K-12 students and other public audiences in engaging and interactive ways.
Related Content for What's This? Just Listen : The Sound of Silence
-
 2022A Universe of Sound
Kimberly Arcand
-
 2019The science of music
Victor Minces
-
 2017Rogue nanoparticles in the environment
Carolyn Wilke
-
 2016Tangible Games for Cognitive Assessment and Training
Kiju Lee
-
 2022BrainWaves: Portable Brain Technology in STEM Education
Ido Davidesco
-
 2017Making STEM More Accessible with Sonified PhET Simulations
Bruce Walker
-
 2019Beats Empire: A Game for Playful Assessment
Nathan Holbert
-
 2019vObjects: Taking the pressure of learning Thermodynamics
Diana Bairakatrova
Jackie DeLisi
Research Scientist
I love the idea of using music to produce data visualizations that students can access! I'm really interested in ways of displaying data and allowing students to interact with data so that they might understand something about their world more deeply. You mention that you want students to be able to hear, see, and manipulate data-- how do you measure the extent to which they are able to do that?
V.J. Manzo
V.J. Manzo
Assistant Professor of Music Technology
With regard to interacting with the data, we are working within our software to provide educators and other experts with tools to "annotate" different sections of the data with descriptive attributes like "good trend", "bad trend", "unstable", and so on, that represent what is taking place within that section. For each of these attributes (there are many!) the sonification engine will alter the musical composition that is heard to more closely represent, with music, these trends in the data by using established musical elements (motives, harmony, etc.). Our intention is also to allow students to graphically alter the visually represented data, which would provide them with narrative feedback about what that change in the data shape would actually mean for the data being observed; this would also result in a varied sonififed musical representation of that change. In a classroom, this would allow an educator to "annotate" some data in the way they'd like (musically using attributes and through narrative text), and create activities through which students are asked to manipulate (literally alter the graphical shape of the data) in directed ways to better understand (visually and auditorially) the impact of such changes.
V.J. Manzo
Erin Ottmar
Assistant Professor of Learning Sciences and Technology
Hi Jackie! This has been a process but we are in the beginning stages of trying to figure out how to do just that. With further support and funding, we are hoping to add a data logging system to the technology system that we have designed to be able to track students engagement and explorations while they use the software. To date, we have been working on developing a feasible system that can fluidly move between data generation, visualization, and sonification. In the past, the sonification system has relied on uploading previously created scientific data. Now that we have a system that works more fluidly, we are hoping to start tackling more of the measurement components of the project.
V.J. Manzo
Julia Griffin
Hi - Very interesting concept you all are exploring! You mentioned that the data you focus on is related to chemical composition of everyday objects. Could this be applied to other kinds of data?
V.J. Manzo
Michael Timko
Assistant Professsor
Hi Julia
Thanks! Absolutely, this method could be applied to many data types. We started with materials chemistry as this was an easy entry point for our team. But, many other data types can be used as well.
V.J. Manzo
V.J. Manzo
Assistant Professor of Music Technology
As Erin mentions in the video, part of our long-term vision is to create a public online data repository in the form of a website where users from many different disciplines can upload and download data sheets that have been annotated and formatted to work with our system.
V.J. Manzo
Martin Storksdieck
Director and Professor
We were tackling data sonification at the last Gordon Research Conference on Visualization in Science and Education - the next one is in early August, btw. Michael, you mentioned that you hoped to attract more students to science this way (or something to that matter): did you? Does data sonification provide an entry point for other forms of data exploration through increased engagement, "ownership" (as you say) or lowering of barriers to data exploration? I am still struggling with the basic conceptual framework for data sonification in meaning-making, and you seem to have some ideas around that.
V.J. Manzo
Michael Timko
Assistant Professsor
Hi Martin - Thanks for your interest! And for the tip on the Gordon Conference. I think it's fair to say that we've just begun to scratch the surface on the potential of this method; it will be at least a few years before we know if it can bear fruit, and we're not really set up to do the long-term types of studies that would be able to assess and quantify impact. What I can say is that students have really enjoyed the experience and gotten into it. Having a chance to work with a group of students and see them light up, enjoy their music, and even make up impromptu dances - all from vibrational spectra - is very rewarding and encouraging.
V.J. Manzo
Bridget Dalton
Intriguing and innovative work! I agree that there is much to be learned from multiple representations, and translating/interpreting data through sound and visuals. This expands modes of representation and expressions, from a universal design for learning perspective. I look forward to learning more!
V.J. Manzo
V.J. Manzo
Assistant Professor of Music Technology
Thanks, Bridget! We have plans to continue working with experts from different disciplines (beyond just chemical engineering) to expand the possibilities of representing different kinds of data with sonified musical gestures; we're trying improve this type of experience for both teachers and other experts who are knowledgeable about the data they are presenting, and students who are trying to interpret and make sense of the data through multiple representations. Thanks again for the kind words!
V.J. Manzo
Janet Yowell
Awesome work! I could see how a teacher would jump on this visual software tool to help students during a time when music is key in their lives, as is the technology to create that music. Very well done! I too am intrigued by the idea of additional representations of different kinds of data. This, in my opinion, is a learning breakthrough for middle school kiddos... such a great hands-on, minds-on tool for learners of all types.
Erin Ottmar
V.J. Manzo
V.J. Manzo
Assistant Professor of Music Technology
Thanks, Janet! We couldn't agree with you more; I'm sure that many of us consider the notion of "student engagement", wow, that concept and the many implications of "engagement" can sometimes be difficult to define! It's well-established that people of all ages "engage" with music in that they feel a sense of ownership and connection to their favorite music as well as a variety of "extra-musical" factors associated with that music such as the musicians, the backstory of the piece of the composer, and so on. Part of our aim in this project is for students interacting with our system to feel a sense of personal connection with the data they are observing (chemical engineering data or otherwise) just as, we hope, those students also feel a sense of personal connection and ownership to the music that they are creating when they first populate the program with data. In this way, even if a student can't play a traditional musical instrument, the Raman spectrometer (or another data-generating device), in a way, can become thought of as the "instrument" through which the notes of their unique and musical learning experience originates. Many thanks for the generous regards!
V.J. Manzo
Further posting is closed as the event has ended.