


- Ashley Lewis Presser
- http://cct.edc.org/people/lewis-presser-ashley
- Research Scientist
- Presenter’s NSFRESOURCECENTERS
- Education Development Center (EDC)
- Jillian Orr
- Executive Producer
- Presenter’s NSFRESOURCECENTERS
- GBH/ WGBH
- Anessa Roth
- https://www.linkedin.com/in/anessaroth/
- Digital Coordinating Producer
- Presenter’s NSFRESOURCECENTERS
- GBH/ WGBH
- Jessica Young
- http://www.ym.edc.org
- Principal Research Scientist
- Presenter’s NSFRESOURCECENTERS
- Education Development Center (EDC)
Engaging Preschoolers in Data Collection and Analysis to Promote Computationa...
NSF Awards: 1933698
2022 (see original presentation & discussion)
Grades K-6
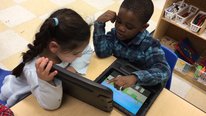
The Preschool Data Collection and Analysis Project aims to promote preschoolers’ engagement with, and learning of, mathematics and computational thinking (CT) with a set of classroom investigations that engage preschoolers in a data collection and analysis (DCA) process. To do this, the project team engaged in an iterative cycle of development and testing of hands-on, play-based, curricular investigations. Promoting young children’s DCA skills through a series of developmentally appropriate problem-solving investigations. A key element of this program is a teacher-facing digital app that supports collaboration among preschool teachers and children to more easily collect data, create simple graphs, and use graphed data to answer real-world questions and engage in discussion. The curricular investigations offer an applied context for using mathematical knowledge (i.e., counting, sorting, classifying, comparing, contrasting) to engage with real-world investigations and lay the foundation for developing flexible problem-solving skills. In a series of nine research-tested investigations, preschool teachers implement six curricular investigations and three scaffolded investigations with themes that emerge from within each preschool classroom (“Create Your Own” investigations). These activities leverage books, hands-on materials, and a digital app to bring the investigation process to life in a fun, developmentally appropriate way. Within each investigation, children practice key math skills (counting, classifying, sorting, ordering, comparing) as they seek to answer the posed research question. By leveraging an app to facilitate the process, children gain experience creating and comparing data representations while simultaneously practicing communication and inquiry skills needed to support the development of systematic thinking.
Related Content for Leveraging Tablets to Foster Preschoolers Data Learning
-
 2020Computational Thinking in Rural and Urban Preschool Math
Marisa Wolsky
-
 2017Early Science with Nico & Nor
Jillian Orr
-
 2022Leveraging Augmented Reality in Preschool Spatial Learning
Ceri Riley
-
 2018Computational Thinking in Rural and Urban Preschool Math
Jillian Orr
-
 2019Computational Thinking in Rural and Urban Preschool Math
Jillian Orr
-
 2018Fostering Preschool Computational Thinking Through Media
Marisa Wolsky
-
 2020Feeling Connected to Others Can Improve STEM Engagement
Marley Jarvis
-
 2019Inclusive Design for All Learners (IDEAL)
Yanghee Kim
Josephine Louie
Thanks so much for this fun and exciting work! Can you share more about the types of data stories that you've seen students create using your app? Because students are in preschool, are they drawing, or recording their voices, or writing, or all of the above? What have the data stories been like? What are students saying about what they see in their data?
Ashley Lewis Presser
Research Scientist
Great questions! The way the app conceptualizes the data stories is through annotating the graphs that teachers and preschoolers have made together. In the Design a Data Story part of the app, it culminates a series of investigations, adding the narrative to create a book-like experience that can help children review details about their investigation. We created a video to show teachers how to use this part of the app.
Children's experiences with the data stories have varied. One example I love is a teacher who integrated the app into their unit on exercise. She showed the children four types of exercises and the children voted on the one they thought they would like best and generated a graph. Then they actually tried all these exercises and voted again on which one they like the best. Their data story focused on observations about what they learned by trying the exercises and what changed their minds from the beginning to the end.
Myriam Steinback
Consultant
Your work with tablets seems fun and exciting. Children are definitely data collectors! How much of it do young learners do on their own? Do students draw? What do students say? I noticed that the app is for parents and educators - are there supporting materials that?
Ashley Lewis Presser
Research Scientist
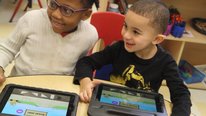
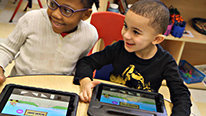
Excellent question! While this was designed to be a teacher-facing app with the teacher holding and operating the app, children definitely use the app by entering data and using the features of the app. For examples, children easily drawing on top of the screen as they talk about the data. We've noticed that over time, children become very comfortable entering data and using the tools. For example, in one classroom, children would gather data from the class by independently holding the tablet and entering the data as they spoke with other children during free play time.
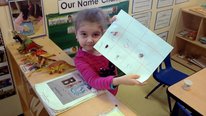
Its also important to mention that while lots of graphs are created with the app, each investigation also includes lots of hands-on experiences and these can be done without the app. For example, in Animal Data Shuffle, each child takes an animal card and physically sorts themselves into the corner of the rug with the number of legs their animal has (0, 2, or 4 legs) and create a graph. Then children sort their animal again by how the animal moves (e. g. run, hop, slither) and create a graph.
We also encourage multiple representations, using hands-on materials to create picture graphs, object graphs, body graphs, and also graphs in the app.
There is a teachers guide embedded within the app and also online. The guide includes a section about the content, preparation, and then links to each investigation lesson plan. In the preparation section, we also have a video library with links to short videos for each investigation and videos about common questions (e.g. making a useful graph, leading a data talk). We hope these supports provide teachers with knowledge and confidence to try it!
Myriam Steinback
Kristen Reed
As an advisor on this project, I'm so proud of the Preschool Data Toolbox App. You can use it on tablets, chromebooks, and some smart phones. Download it for free here on the Apple App Store: https://apps.apple.com/app/preschool-data-toolb... or on the Google Play Store: https://play.google.com/store/apps/details?id=o...
You can find the Teacher's Guide here: https://first8studios.org/gracieandfriends/guid...
Myriam Steinback
Jillian Orr
David Kung
Director of Policy
I love seeing how data can be introduced to students so young! Are there ways in which these students struggle to understand data visualizations that are different from older students? How does mathematical maturity (whatever that is!) play into this particular skill?
Ashley Lewis Presser
Research Scientist
Yes, great point! We designed the app for use with young children due to this concern about developmental appropriateness. Since its teacher-facing, we expect teachers to be heavily involved in scaffolding the process, but in the design process, we tried to make the interface intuitive enough that children could follow. We don't expect preschoolers to be able to read directions, so the steps are laid out the same way in each investigation.
In terms of understanding the data visualization, we kept the options for visualizations very simple. The existing investigations present a pictograph format that then converts - using the slider function - to a box for each data point, then a full bar graph. The "create your own" section of the app allows teachers to use a tally chart as well! Throughout, teachers and children can use the photo feature to create images for their variables to make them meaningful.
A key element of each investigation is our "Data talk" in which we suggest teachers encourage discussion about what the data means - and prompts for this discussion are embedded in the app tools. For preschoolers, that often starts by talking about how many are in each category, then identifying the variables with the most/least, before talking about how the data helps answer the original research question (listed at the top of the screen). There is also a feature to compare two graphs on one screen to further the discussion in selected activities.
Jessica Young
Principal Research Scientist
One thing that was really great to see in our study with teachers was that they came away with a new appreciation of preschoolers' abilities--they were so impressed that the preschoolers could learn how to "read" data visualizations and were able to grasp some complex mathematical concepts much younger than they would have expected! We could tell that the teachers felt so proud of their students and they were excited to have a tool they could use to more easily do data collection and analysis with their students.
Noelani Ogasawara Morris
Demonstration Teacher
I love this app! As a teacher of 6-8 year olds, we engage in data collection in our classroom as well and part of the process is giving the students the opportunity to develop their own research question, create their own categories, and organize their data. Is this app intended for teachers to have majority of the control of inputting the data or is there a space for students, ones that are slightly older in possibly 1st and 2nd grade to use the app to collect and share their data based on their own research questions?
Jillian Orr
Ashley Lewis Presser
Research Scientist
What a great question! We actually do want to design an interface that would allow children in early elementary school to create more complex representations, so I'd love to talk with you about wht you think that might look like. The current app is flexible enough for children 6-8 to engage with on their own, using the "Create Your Own" section of the graph. Teachers may need to help with the writing of the research question, depending on children's reading and writing skills.
Noelani Ogasawara Morris
Demonstration Teacher
Nice! What types of technology (iOS, android) does that app support and is it free ? Would love to explore and play with it in my classroom.
Jillian Orr
Ashley Lewis Presser
Research Scientist
Hi Noelani! Yes, its available on iOS and Android tablets:
Web-Based Teachers Guide, Apple App Store, and Google Play App Store.
Jillian Orr
Executive Producer
So excited that you are interested to use it with your classroom, Noelani! We'd love to hear any thoughts you have after you try it out! :)
Chih Ing Lim
Thanks for sharing this. I love that there are multiple ways children are engaged in data visualization - not just via the app but also other hands-on screen free opportunities, and also the wrap-around educator guides. Were there adaptations that you may have to make in ensuring these experiences were accessible for young children with disabilities as well? Thanks.
Ashley Lewis Presser
Research Scientist
Excellent point about accessibility for young children with disabilities. We have not yet focused on this; however, teachers using the intervention have made adaptations along the way as they implement. Most of these adaptations have focused on adapting for the developmental level of the children, as many preschool classrooms have a range of ages (3-5) and abilities. Starting with those adaptations may also tell us a lot about how to adapt for children with disabilities.
Karen Page
Sorry to ask another technical question, but is there any reason this would not work in international settings? I will explore it, but I'm wondering if it is US-centric in design or if there are users around the world finding this usable and there are no barriers to accessing it outside of the US. I often work with countries who have a priority to use more technology to help students connect content to real-world experiences and career paths such as the Data Scientists you mention. If it is free, works on iOS and Android - is it working around the world? Looks like it wouldn't be a big data draw which is good. Thank you!
Myriam Steinback
Ashley Lewis Presser
Research Scientist
Hi Karen--Great question! Since we're using apple tablets in this project, I don't see any reason that wouldn't work the same way internationally. Our previous apps have been heavily downloaded abroad, but we will check on whether this is an issue with this particular app.
Jillian Orr
Executive Producer
Thanks for your question, Karen! The app should definitely work abroad! (And you're right, it's not a big data draw -- our team works hard to ensure that. :))
Your work sounds amazing! Excited to hear if you use it!
Further posting is closed as the event has ended.