


- Josephine Louie
- https://www.linkedin.com/in/josephine-louie-89946a9/
- Senior Research Scientist
- Presenter’s NSFRESOURCECENTERS
- Education Development Center (EDC)
- Pamela Buffington
- http://ltd.edc.org/people/pam-buffington
- Director of Rural STEM Initiatives
- Presenter’s NSFRESOURCECENTERS
- Education Development Center (EDC)
- Emily Fagan
- Non Profit
- Presenter’s NSFRESOURCECENTERS
- Education Development Center (EDC)
- Brian Fitzgerald
- Director of Science and Education
- Presenter’s NSFRESOURCECENTERS
- Mount Washington Observatory
- Brianna Roche
- https://www.edc.org/staff/brianna-roche
- Research Associate
- Presenter’s NSFRESOURCECENTERS
- Education Development Center (EDC)
- Asli Sezen-Barrie
- https://umaine.edu/edhd/facultystaff/asli-sezen-barrie/
- Associate Professor
- Presenter’s NSFRESOURCECENTERS
- University of Maine
- Kevin Waterman
- https://www.edc.org/staff/kevin-waterman
- Project Director
- Presenter’s NSFRESOURCECENTERS
- Education Development Center (EDC)
Choice
WeatherX
NSF Awards: 1850447
2022 (see original presentation & discussion)
Grades 6-8
WeatherX is an NSF-funded ITEST project that is collaborating with middle school science teachers in New Hampshire and Maine to promote data literacy and interests in data science careers among students from low-income rural communities. We have developed and have been testing two 3-week prototype curriculum units in which students investigate local weather patterns using large-scale data collected from NOAA and extreme storm data from the Mount Washington Observatory (MWO) - a site that has been called the "Home of the World's Worst Weather."
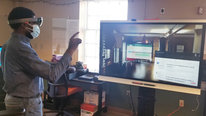
Students use the online tool CODAP to visualize weather data patterns and to conduct their data analyses. They learn about existing weather knowledge in their local communities by interviewing family and community members about their experiences with extreme weather. They also learn about professional weather data collection and the lives of weather scientists through live "Chat with a Scientist" events with weather observers who work at the summit of Mount Washington Observatory (MWO).
With a mixed-methods and iterative research approach, we have tested an alpha version of our prototype units and are now completing a beta round of testing with 6 middle-school science teachers and their students. We have been collecting student pre- and post-assessment data; student focus group and survey data; student work samples; teacher implementation logs and interviews; and classroom observations to investigate whether and how WeatherX learning experiences support growth in students' understanding of core data practices, interests in data analysis, and career interests in working with data.
Our interdisciplinary project team consists of education researchers, curriculum developers, learning scientists, and technology developers. Team members include Jo Louie, Emily Fagan, Kevin Waterman, Brianna Roche, and Pam Buffington from Education Development Center (EDC); Brian Fitzgerald from MWO; Asli Sezen-Barrie from the University of Maine-Orono; Deb Morrison from the University of Washington-Seattle; and Bill Finzer from the Concord Consortium.
Related Content for WeatherX: Building Data Literacy among Rural Youth
-
 2021Exploring local weather and seismic data with DIY IoT
Deren Guler
-
 2019Mapping the Invisible: Practicing STEM Literacy
Betsy Stefany
-
 2022Building Data Literacy Through the Arts
Anna Amato
-
 2018Advancing STEM: Data Systems Inclusion in Student Learning
Betsy Stefany
-
 2021An online student coding bootcamp on COVID19 data analysis
Hong Qin
-
 2021Virtual Citizen Science Expo
Nicole Colston
-
 2017Spatial STEM+C: Developing Comp Thinking and Math Skills
Steven Moore
-
 2015Sampling in the Snow: If All You Have is Winter, Use It!
Annette Schloss
Josephine Louie
Senior Research Scientist
Thanks for visiting our video! We’re excited to share our project, which has been working to promote data literacy and student interests in data science careers in low-income rural areas.
We have developed two multi-week curriculum units for middle-school science classes and have been testing them with teachers and students in rural parts of New Hampshire and Maine. We have also developed an online portal that provides access to historical and current NOAA weather data from almost 2,000 weather stations across the U.S. This portal is freely available to the world through CODAP, the online data analysis tool that students use with our curriculum materials.
Some key learning strategies that we have employed in our curriculum units include:
Some questions that have arisen in our work include:
We welcome your reactions, thoughts, and insights.
Brianna Roche
James Callahan
Yea, Weather X!
You are such an important part of the Showcase. Great video.
It's a given that your work provides essential resources to the enormous and influential collection at CLEAN.
I'm making sure that CLEAN staff, and my many close colleagues in the CLEAN Network, come visit your page, and are being sure to utilize your highly valuable resources.
Full disclosure, on why I consider this video to be highly important. Together with CLEAN, we're looking at two of the most important NOAA related entries in this year's Showcase.
This program provides highly valuable resource for teachers. Thank you for your magnificent work!
Brianna Roche
Emily Fagan
Project Director
Thanks James! It's great to be doing this important work together and thanks for sharing it with others. I will do the same. I just watched your video too and it is very inspiring! Great to see those students in action to help organizations reduce their carbon footprint --and to show such leadership and passion. It looks like a fantastic project that is helping students build many skills. Enjoy the showcase!
Josephine Louie
Lexi (Elizabeth) Phillips
Wow! What these students are being taught is so important for everyone's futures on this planet. Starting young with this knowledge and keeping them engaged with these activities seems highly effective. Thanks for sharing!
Our video, "TEACHHouston: Journey of a STEM Teacher", also involves the applications of mathematics into the "real world" for students who may otherwise be uninterested. You can view our video with this link:
https://videohall.com/p/2511
Brianna Roche
Research Associate
Hi Lexi, thanks for sharing! It's great to see the many different ways we're learning about activating STEM interest and identity.
Kathryn (Katie) Boyd
This project looks great! If your curriculum has a climate focus at all, please consider submitting it for inclusion in the CLEAN collection (a database of over 800 teaching resources on climate & energy topics which serve as the backbone for the NOAA Teaching Climate site). You can suggest a resource here.
Josephine Louie
Senior Research Scientist
Hi Kathryn,
Thanks for checking out our video! Yes, an important theme in our curriculum units is understanding the difference between weather and climate, which we build through investigations of weather and climate data.
Students begin by learning to distinguish between these two concepts in everyday ways (e.g., weather affects the clothes we decide to wear today; climate affects what clothes we have in our closet). Then they also learn to make claims about whether weather components (such as temperature and wind speed) are typical or extreme for a specific location and timeframe by looking at local weather measurements and 30-year climate normals. For example, using CODAP, students create time series graphs and dot plots of temperature and wind speeds during the 2015 Presidents' Day storm on the summit of Mount Washington, and they examine how average, minimum, and maximum temperatures and wind speeds during the storm compare to 30-year climate data for the summit. They learn that there is a quantitative basis for evaluating "typical" and "extreme" weather, rooted in examining both short-term weather and longer-term climate data (and applying understandings of statistical concepts such as averages and outliers).
We look forward to exploring your resources, and we hope our data-focused units may be a good fit!
Kathryn (Katie) Boyd
Emily Fagan
Project Director
Hi Katie, Thanks for making the connection! Our team members and advisors familiar with your work have also encouraged us to submit our lessons to the CLEAN collection. What a great resource you and your team have developed and made freely available to educators. With our recent implementation wrapping up, we are turning our focus to integrating feedback and revising the lessons for dissemination. We hope they can be included. Thanks for the great work you are doing to provide engaging experiences for students to learn about and act to address the threats of climate change.
Kathryn (Katie) Boyd
Ashley Lewis Presser
Wow, I love the way students can analyze their local weather! What kinds of challenges, either in terms of implementation or student learning, are most common for teachers as they start using these tools with students?
Asli Sezen-Barrie
Associate Professor
Thank you for your question, Ashley.
Other than the learning curve challenge, we faced difficulties translating real storm sceneries into middle school level learning activities. The storms can be affected by many variables (temperature, wind speed, pressure, altitude, geographic positioning, etc.) and have unique circumstances. Iteratively working with scientists and teachers has been helpful to focus on days/times that will show trends with a couple/multiple variables. The other challenge was also navigating a hands-on science classroom culture (you can see more detailed Q & A on this below).
Kevin Waterman
Project Director
Thanks, Ashley!
One of the biggest challenges has been the fact that many students haven't had much experience with reading graphs, so in some cases students need a bit more scaffolding to be able to decipher what the graph tells them (especially when there are a lot of data points).
The wealth of data available through the CODAP Weather Portal is fantastic, but there is a bit of a learning curve to adapt the materials to specific locations. During our project, the curriculum development team has done most of that data curation for our test sites. Among our next steps are ways to streamline that process, and provide professional learning opportunities, for teachers in any region to use the activities with their own data sets. The portal is pretty self-explanatory, but since it draws on real weather data from NOAA, some care needs to be taken to make the data sets (and the resulting graphical representations) usable for students.
Jessica Young
This is so interesting! I'm curious if you have noticed whether students have had more trouble reading and interpreting certain types of graphs? We are developing data science activities for preschool and so it'd be interesting to see if providing certain types of data displays or visualizations could scaffold their ability to decipher graphs as they get older and into middle school.
Josephine Louie
Senior Research Scientist
Thanks for your question, Jess! Students spend the most time in our units creating and examining time series graphs as well as dot plots of weather components such as hourly (or daily or monthly) temperatures, winds speeds, precipitation levels, air pressure levels, etc. During an earlier iteration of our materials, we tried introducing dot plots first, because students in theory should have seen these in elementary school (or in preschool, if they had used your apps). ;) In the end we introduced time series graphs first, because students found them less abstract and more intuitive to understand. In our weather context, it was easier for students to make sense of the fluctuating patterns of hourly temperatures over the course of two days (for example) than to grapple with the distribution of the same temperature measurements in a dot plot. Most of our students did not have much prior experience with any type of graphing. It would be interesting to do more research on whether time series graphs are generally easier to understand than dot plots (especially when working with weather data, which has an inherent temporal component).
Abigail Stark
This is absolutely fascinating! I’ve been to Mt. Washington a few times before and learned about the observatory’s history, and to see the data gathered from there used in such a way warms my heart. This kind of data is publicly available and yet there seems to always be a barrier between getting your hands on it and understanding what it means. To see people only a few years younger than I am learning about it andengaging with it gives me hope.
Josephine Louie
Senior Research Scientist
Hi Abigail -- Thanks so much for checking out our video. The work you have been doing in D.C. with fellow students is truly inspiring. You must be a guiding light for so many people (of all ages!) around you.
You are right that there are ever growing troves of data for people to explore, but it takes significant time and effort to assemble these data and make them accessible for meaningful and engaging learning experiences. We're grateful for the opportunity we've had to create and test multiple sets of these experiences with teachers and students.
The more that students examine extreme weather data, however, the more questions arise about what people can do in the face of more frequent hazardous events. One of our goals is to find and include more examples of collective action that can make a positive difference in the caretaking of our environment and each other. Through this showcase we have learned about your amazing example. We may come knocking on your door to see if we can share your story!
Anne Gold
Wonderful video and inspiring project! Thank you for sharing. I am particularly impressed by the combination of storytelling, data analysis and meeting with scientists that you use in the project. Such an engaging model. How has COVID impacted your implementation?
Josephine Louie
Senior Research Scientist
Hi Anne,
Thanks for visiting our video, all your support, and your question. COVID delayed our testing and development schedule – it hit just as teachers were about to implement the first iteration of our first unit (in the spring of 2020). We had to wait until fall 2020 before teachers’ school lives had settled and they were willing to test new materials like ours.
COVID also had some effects on the design of our materials and how our lessons played out in classrooms. For example, we had to eliminate an activity in which students learn about air pressure and wind by blowing up and releasing air from balloons in the classroom (sadly, we quickly realized how impossible that activity was during COVID!).
In some classrooms, it took much longer for teachers to complete individual units because the pandemic would send entire classes home for a week or two of remote instruction during peak infection rates, or multiple students would be quarantined at home for many days. We also designed our lessons with the intention that students would investigate data and discuss weather and climate concepts in pairs and small groups. Unfortunately, for large stretches of our unit testing, students had to sit masked at socially distanced desks/tables, sometimes behind plexiglass barriers, investigating data individually, with discourse typically volleying back and forth between the teacher and students and not so much among students. Conditions have certainly improved this spring, but most of our data collection has occurred under classroom conditions that we never imagined when we began.
Asli Sezen-Barrie
Associate Professor
Thank you for your comments and questions on our video Anne. In addition to impacts on classroom implementation, COVID conditions impacted the way we designed our professional learning sessions and research data collection process. We iteratively revised our professional learning design from the long day sessions we held at the Mount Washington observatory. We relied on shorter evening/late afternoon sessions and utilized virtual ways of engagement. Since most of our data is collected in virtual environments, we have learned effective set-ups and resources for our participants and for us.
Joi Spencer
Interim Dean and Professor of Mathematics Education
Hello Josephine and team-
I am excited to learn about this program. I notice that you are working with middle schools students. When you work on the units, is this work going on in science classes, mathematics classes, social studies or some other course? Perhaps it varies from school to school. I am curious about how data science is seen as a topic and how this might influence how students engage with the ideas. If in mathematics courses, for example, do different aspects of the units get emphasized vs. when the units appear in a social science course?
(I am also curious about whether or not questions and conversations about climate change emerge and how these are navigated.)
Josephine Louie
Senior Research Scientist
Hi Joi,
Thanks for your questions, and for providing us the opportunity to clarify our project context! Yes, I neglected to make clear in our intro that our units are designed for middle-school science classes. Over the course of two (COVID-filled) years, we have tested two iterations of each unit with between 4-6 science teachers and what’s now approaching 500 students. Although we originally intended to target our units for grade 8 science classes, our teacher collaborators have used them with students in grades 6-8. Many of our partner teachers are the only science teacher in their rural middle school and teach multiple grades – often covering a weather unit before grade 8. Some teachers have used our units with all of their classes across each grade level – because they wanted to give all of them the opportunity to work and learn with authentic weather data from their local area and from Mount Washington!
You pose another great question about how data science is seen as a topic in our classroom settings. Interestingly, some have shared with us that they think it’s critically important and exciting to give their students opportunities to learn to analyze data in their science classes. Some of these teachers previously taught mathematics or have worked with data in their own college/graduate school days and have seemed more comfortable with the data concepts.
Other teachers appear to have been attracted to our work for its inquiry-oriented nature and the opportunity to connect with scientists at Mount Washington. In interviews and written reflections, some of these teachers felt that there may have been too much “math” and data in our materials and asked: “Where is the science?” Although we intersperse data investigations with lessons that focus on learning weather and climate concepts (to help students explain data patterns and the causes of extreme weather events), it seems that our extended data investigations didn’t feel like “science” learning for some teachers. We have found this reaction very interesting and may try to write about it – and its implications for science education.
Finally (sorry for the long response, but you asked such great questions!), yes, conversations about climate change do arise. Teachers have relayed (and we have observed) that when students share out findings from their interviews with family/community members about their experiences with weather, a recurrent theme emerges: temperatures have gotten warmer and snowfall has diminished over time. Family and community members are noticing these patterns, and students are learning about these changes from these trusted contacts. Our lessons do not focus on the causes of climate change, and we don’t currently have information on whether and how teachers discuss the causes. (I’m thinking that we should add this question to our interview protocol as we wrap up our final conversations with teachers!)
Joan Ferrini-Mundy
University President
Fascinating project. Although you state as a goal to promote data skills, I assume students learn about weather and climate change as well. Do you track outcome measures on students' knowledge growth on that content? The notion of interviewing family and community members is great, especially in rural communities who experience extreme events. Do you have any information, even anecdotal, about how the family/community members feel about being interviewed, any sort of catalogue of the kinds of questions they ask, and if/how the results and answers are conveyed back to them? This could be related to Joi's question about questions and conversations about climate change.
Josephine Louie
Senior Research Scientist
Hi Joan,
Thanks so much for your great questions. Yes, our research questions focus on examining whether and to what extent students demonstrate growth in their understanding of basic data concepts (as well as their academic and career interests in working with data), using established pre- and post-assessment measures. We are not trying to measure quantitative growth in student learning of specific weather or climate concepts, but we have collected all the written work products and graphs that students create in CODAP as they progress through each lesson. Questions that we are interested in exploring include how students describe “extreme” weather, what may cause changes in weather, and how students’ descriptions/understandings evolve over the course of each unit.
You then ask some interesting questions about students’ interviews with family/community members. We don’t know how interviewees feel about the activity – but you’ve sparked the idea that perhaps we should find out! Teachers have told us that when parents learn about our project, some have said that they wish they could participate in WeatherX too.
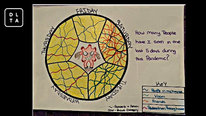
In focus groups and surveys, students have told us that one of their favorite activities in WeatherX is the interview with a family/community member and sharing the stories they’ve heard in class. We provide students with a set of questions that they can use and adapt for their interviews, and in an early lesson, they practice conducting the interview with a classmate before conducting the interview for real. We designed a structured activity for students to share their interview results in class through both written responses to prompts on chart paper and whole-class discussion, but we haven’t considered a way to share results back with family/community members. This is another great idea!
Asli Sezen-Barrie
Associate Professor
Thank you, Joan, for your comment and questions on our video. Adding to Jo's response on using students' artifacts to look at their weather and climate conceptions, student focus group interviews also showed how some students developed an improved understanding of weather components. For example, they realize how the temperature is typically low in the evening, locations that are closer to the lake, etc. This understanding helps them understand why weather observers measure temperature at certain spots and during certain times. Therefore, these preliminary qualitative finds can inform how using data practices in science classrooms can help students learn how to do science in complex weather and climate science topics. More on climate and climate change, Jo mentioned that we are looking at conceptions of "extreme weather." Our focus has been on resources students use to describe/explain extreme weather, their positioning, and the references to spatiotemporal practices. One thing that evolved from that study was to compare students' conceptions to those of scientists, our interdisciplinary project team, and teachers. These comparisons help us understand where confusion and uncertainties might occur in learning about extreme weather.
Rita Hagevik
Extreme weather is something we will all need to get used to so developing curriculum around it is really important. I love the local connection. Yes you are correct in that an inside-outside approach works best. I look forward to the curriculum!
Brian Fitzgerald
Director of Science and Education
Hi Rita- thanks so much for taking the time to watch our project video and for your comment. The folks here at Mount Washington Observatory have been really excited to share our expertise and experience with extreme weather, and help students use data to make arguments about what is truly "extreme." The partnership with curriculum developers/evaluators at EDC, University of Maine, University of Washington, and technology experts like those at Concord Consortium all made this possible! We're hopeful that we can inspire and possibly drive similar partnerships elsewhere as a model for exploring big weather data that is regionally and locally relevant.
Brian Fitzgerald
Director of Science and Education
Hi Anne- thanks for your question! The pandemic impacted our implementation in a few different ways. Largely, the teacher PD, student interviews, classroom observations and other aspects of the project needed to shift to virtual settings that had some benefits (reduced travel for many project team members for instance). On the flip side, these virtual meetings don't necessarily provide the same experience as having folks in person to witness how materials are being received in the classroom. Many of the schools that we worked with in rural NH and ME were able to mostly able to continue instruction in-person throughout the pandemic; however, student absences and some hybrid instruction presented some additional challenges to implementation and additional screen time. Our curriculum team spent a fair amount of extra time revising units to allow for hybrid and virtual instruction, along with changes to some of the small group activities that were in the original versions of the units. Thankfully, our project team was already working virtually with team members spread out throughout the region and country, which kept work flowing throughout the project. The scientists on Mount Washington were also positioned to connect virtually before the onset of the pandemic, which was very lucky! Thank you again for your question!
Tichina Ward-Pratt
Educator
This is an amazing project. I appreciate the focus on preparing young people to think about climate change and be at the center of making changes in their communities.
I wonder how much of your teams' efforts in building this curriculum is guided by local community members who have experienced these extreme weather conditions or whether disasters?
Josephine Louie
Senior Research Scientist
Hi Tichina,
Thanks for your great question. We had originally considered organizing community "science nights" at our local schools (which often serve as community centers in rural areas) to gather local knowledge and input into the design of our weather units. But COVID nixed all that. Instead, our collaborating teachers were major sources of initial input into the weather events for students' data investigations. We worked with local teachers from the very beginning to learn more about their personal weather experiences in the local areas. Our project partners at Mount Washington Observatory and at the University of Maine also live in the areas where we are working. In addition, As students began interviewing family and community members about their local weather experiences, we took that information to inform later lesson revisions. As you can see, our development process was very place-based, which is now forcing us to think creatively (and to consult existing research) on how to transfer our learning materials to other locations across the country. Is it possible to listen deeply within local communities and do truly collaborative place-based work that engages students in locally relevant ways, at scale?
Tichina Ward-Pratt
Ravanasamudram Uma
Great project introducing data science at the middle school level. How did you recruit the schools and teachers to participate in this project? In schools that did participate, did all science teachers in grades 6-8 participate or only a subset? Was there any pushback since this takes 3 weeks? Was the 3 weeks consecutive or spread throughout a year/half-year? In terms of lesson planning did the participating science teachers coordinate with the Math teachers so that the students could get the relevant math content from their math class?
Josephine Louie
Senior Research Scientist
Hi Ravanasamudram,
Thanks for checking out our video and for your questions! We recruited participants through multiple channels. I'm at EDC, and our organization has deep knowledge of and strong connections with school districts and rural regional networks throughout New England. Our project partners at Mount Washington Observatory and the University of Maine also have extensive connections with schools and educators in the region. We were able to tap into these networks to advertise and recruit for participants. Most (but not all) of our teacher recruits have been the only science teacher in their school for grades 6-8.
We did not intend for our units to take 3 weeks to implement; our original goal was 2 weeks. There have been a couple cases where teachers finished each of our units in two weeks - either because they omitted some lessons, or their classes were much faster in understanding and completing the materials. (Some of our research will try to probe why there has been such variability among schools and classrooms.) In other cases, teachers took three weeks or more to complete a single unit. Although all of our teachers worked to implement our materials during consecutive days and weeks, those who took longer to complete the units reported frequent disruptions (Covid-related student or teacher absences, or shifts to remote learning; other scheduled field trips or school events, etc.).
As for science and mathematics teacher collaboration: We never stipulated that such collaboration was a requirement, but we had hoped some teacher pairs might sign up. In fact, with our first teacher cohort, we in fact did have such a pair. Sadly, Covid hit right after we had provided them with PD and they weren't able to implement the unit together (which is what they had planned). None of the other participating science teachers have worked with mathematics teachers to deliver the units, but several of them have taught mathematics previously. We also designed the lessons to ensure that the statistics and data practices would be accessible for students in the middle grades, including concepts that are in the Common Core State Standards for mathematics in the elementary and early middle grades (and providing lots of scaffolds and supports for those students who, sadly, hadn't seen or weren't strong in those concepts and practices, like basic graphing).
Leigh Peake
Great to see the progress you've made in WeatherX and the knowledge you're assembling about student work with weather and climate data. I found the response that the modules didn't feel like science fascinating. We see that in our community (citizen) science work in classrooms -- there's been such a long, strong push for hands-on inquiry that many teachers leave off having students work with the data after it's been collected, which of course also cuts off the experience of how the data informs sense-making about the original question. I think this would be an interesting line of new research for you! Thanks so much for your work and your video!
Josephine Louie
Senior Research Scientist
Hi Leigh,
Thanks for watching our video, and for being a great friend to our project! Yes, it has been very interesting to discover that some of our teachers felt that there was too much data and not enough "science" in our units. Within our project team, which includes former science teachers, mathematics teachers, researchers, etc., we've certainly worked from the start to develop lessons and units that have a balance of CODAP-based data investigations and other types of learning activities (e.g., hands-on examination of warm and cold water masses to provide insights into hot and cold air mass movement; community interviews; outdoor weather observations; short videos and readings; etc.). But for some teachers, we didn't seem to get the balance right, particularly in our earlier unit iterations. We are indeed very intrigued by this finding, and its implications for science teacher education and practice, especially as big data enters ever more arenas of science practice.
As for students, we learned early on from surveys and focus groups that students start complaining when they spend too many consecutive days looking at data on a screen - even when the tool is interactive and dynamic like CODAP. When we've asked students how we might improve the units, they inevitably say they want more "hands-on" activities. When we ask for examples, we've heard answers like "exploring with slinkys" or "slime!". We are in the process of analyzing our pre/post data for evidence of student learning and growth in data analysis interests, but whatever our findings, it's quite possible that we haven't yet designed data investigations to out-compete slime.
Leigh Peake
100% consistent with what we hear, Jo.
John Ristvey
This is a very interesting project and the video was well done! I thought it was interesting how the local context for the weather as a motivator in a rural community. What have you learned about student agency in exploring the NOAA data? Also, I'm curious how WeatherX has the potential to work in other communities (Kevin, can you elaborate on your comment "earning curve to adapt the materials to specific locations"?) Finally, Can you say more about the story collection aspect of your project? What did the students do with the stories? Thanks for sharing your project through this awesome video!
Kevin Waterman
Project Director
Thanks, John.
There are a bunch of contributors to that learning curve that range across several areas. Few of them have a major impact on the learning, but all can cause (unnecessary) confusion, especially to students (and teachers) who haven't had much experience working with real, uncurated data sets.
The primary issue comes down to selecting the right site to get data from and being prepared for any inconsistencies that may arise:
The local unit definitely has potential to work in other communities, and we will be exploring how to address the questions above and provide supports for that to happen. We're also curious about the Mount Washington focused lessons, and whether that location has more universal interest, or whether we can partner with other institutions at different sites regionally to tailor that part of the curriculum as well.
Josephine Louie
Senior Research Scientist
Hi John,
Thanks for checking out our video! I love your video and the work you are doing in Colorado.
Kevin provided more background on some of the challenges that we've tackled to bring a wealth of NOAA data to students in ways that are locally relevant, engaging, and tractable to support key learning objectives within available timeframes in science classrooms. Because there are so many weather stations whose data students can investigate, and because different stations report data with different sets of weather variables and timeframes, we ended up curating data sets for students to ensure they could focus limited classroom time on making sense of data patterns rather than cleaning data or looking for stations with more complete data.
We have created some extension activities, however, for some teachers with students who proceed through our materials much faster than their peers, to allow them to explore data from weather stations anywhere in the country and to hunt for and do follow-up research on extreme weather events. We'll find out how students respond when some of them are set free to explore the data in the NOAA weather portal!
In addition, you asked what students have done with the data stories they have collected. I will assume you're referring to the interviews that students conducted with family/community members about their weather experiences. After students conducted their interviews, their assignment was to summarize what they heard in their own written reflections, and teachers led a structured lesson where students shared their findings by writing responses to specific prompts on chart paper (e.g., Who did you interview? What did you learn about their work and activities and how they are affected by weather?). Students conducted a gallery walk to read and comment on what their peers wrote, and teachers led whole-group discussions of students' findings afterwards. We haven't structured into our lessons any activities where students might do more with their stories and findings, but your question (like another comment above) raises the excellent point that there may be opportunities for more synthesis and sharing -- particularly back to the community -- if teachers feel there is time and it is an activity they can work into their schedules. The students loved learning about weather experiences through the people they interviewed -- I can envision how meaningful it could be to bring students and families/community members together for joint sharing and learning.
Kristin Flaming
I love that you are using something students are passionate about, their home town, to engage the students in data science. We allow students in Passion-Driven Statistics to choose topics they are passionate about from archival research to work throughout the semester on.
Do students have the option to take additional elective courses related to statistics and research at their school? I am curious to know if those taking this course are gravitating to those courses compared to other students not taking this class.
I am excited for the next generation of students that have exposure to data science to enter Introductory Statistics courses. These empowering experiences is creating a pipeline into the industry that is needed.
Josephine Louie
Senior Research Scientist
Hi Kristin,
Thanks for watching our video, and for your comments! I am inspired by the passion in your project and video. :) In fact, there is lots of overlap between your project and our other project, which we shared in a video last year: https://stemforall2021.videohall.com/presentati...
For our WeatherX project, we've been working with teachers and students in rural middle school science classes. We're not aware of too many electives in our partner schools, and we're not tracking students' coursetaking patterns. However, we have administered pre- and post-surveys and assessments to students, and we will be examining whether students' academic and career interests in working with data increases after completing our units. We know from student focus groups that many students have said they feel much more confident with graphing and data analysis after completing WeatherX lessons. We know from our other project (shown in the video link above), which focuses on high school students in non-AP mathematics and statistics classes, that students displayed statistically significant growth in their learning and interests in analyzing data after completing our statistics/data literacy units on social justice issues. We're itching to finish data collection and to start data analysis for WeatherX to see if we have similar findings from our rural middle-school youth.
Kristin Flaming
Thank you for sharing your video from last year. I am not sure how I overlooked it last year. I did not see a link to your resources for that project. Can you share it?
We have found much the same in terms of increase in student attitudes to statistics, interest in follow-up courses, and their confidence toward different concepts and processes.
Kristin Flaming
Josephine Louie
Senior Research Scientist
Hi Kristin -- Sure, here is a link to our website for the social statistics project, where we have released one full module and will release a second one this summer: https://sites.google.com/view/uss-data/home
We will also be releasing our two WeatherX units later this year. In the meantime, the Microdata Portal that provides access to U.S. decennial census and American Community Survey data (from 1850-2017), and the NOAA Weather data portal that provides access to weather data from across the U.S. (spanning decades), are both free plug-ins within CODAP (built by our partners at the Concord Consortium) for anyone to use at codap.concord.org.
Kristin Flaming
Kristin Flaming
Thank you!
Further posting is closed as the event has ended.