

- Lisa Dierker
- https://www.wesleyan.edu/academics/faculty/ldierker/profile.html
- Walter Crowell University Professor of Social Sciences
- Presenter’s NSFRESOURCECENTERS
- Wesleyan University
- Kristin Flaming
- Valdosta State University Department of Psychological Sciences
- Presenter’s NSFRESOURCECENTERS
- Wesleyan University
A Data-Driven, Multidisciplinary Curriculum Providing Access to the Data Anal...
NSF Awards: 1820766
2022 (see original presentation & discussion)
Grades 9-12, Undergraduate
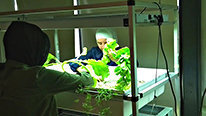
Passion-Driven Statistics is a project-based introductory curriculum that has been implemented as a statistics course, a research methods course, a data science course, a capstone experience, and a summer research boot camp with students from a wide variety of academic settings. In this video we share our work with high school students enrolled in GEARUP. The curriculum engages students in authentic projects with large, real-world data sets (e.g. National Household Survey on Drug use and Health, The Behavioral Risk Factor Surveillance System, and National Longitudinal Study of Adolescent to Adult Health) from the very first day! The focus is on welcoming and empowering students to ask and answer questions they care about.
Related Content for Passion-Driven Statistics
-
 2021Taking Passion-Driven Statistics On-line
Lisa Dierker
-
 2019Seeding the Future with Change Makers
Rajeev Rupani
-
 2020CAHSI: An NSF National INCLUDES Alliance
Ann Gates
-
 2019Lessons Learned from Launching High School Manufacturing App
Matthew Fieldman
-
 2021Casa Azul Productions
Bianca Alvarado
-
 2020Passion-Driven Statistics: Data Analytics for Everyone
Lisa Dierker
-
 2017Early STEM Engagement for Minority Males (eSEM)
Cindy Ziker
-
 2018A Peek at iCREAT Project’s Multi-Disciplinary Courses
shamsi moussavi
Lisa Dierker
Walter Crowell University Professor of Social Sciences
Welcome! Passion-Driven Statistics is a project-based, introductory curriculum that has been implemented at liberal arts colleges, large state universities, regional colleges/universities, medical schools, community colleges, and high schools. Our goal is to create a welcoming (and empowering) experience that opens the analytics economy to everyone! Hear about our experiencing using Passion-Driven Statistics as a summer data camp experience for high school students from the Gear Up program.
Kristin Flaming
Barbara Hopkins
Hi Lisa: I love the term Analytics Economy! I wonder if your work has helped inform public schools and communities that Calculus is not the only mathematics education goal. How we support public education to define alternative mathematics pathways to career success is a paramount concern! Many schools appear stuck in the traditional high school mathematics curriculum: Algebra 1, Geometry, Alg II/Trig, and Calculus. Has your work helped define a statistical/analytical pathway for high schools experiencing your program? We do have schools offering AP Stats...but I would love to learn about other high school courses resulting from this work.
Kristin Flaming
Lisa Dierker
Walter Crowell University Professor of Social Sciences
Hi Barbara. Other than the boot camp model, we do have some high schools that are using the curriculum either in a general statistics course or as a project at the end of a full year AP statistics course. Where I see it actually impacting mathematics pathways however has been among our community college partners. San Mateo County Community College District and others are beginning to get students directly into an applied statistics course as their first math course. This has helped them get college level math credit from the start. I agree that the math pathway needs a major over hall. What I have been most excited about is work being done at places like the University of Richmond (https://inclusivescience.richmond.edu/smart/ind...) where biology, chemistry and mathematics are integrated with one another and with a discovery-based laboratory component. These disciplinary boundaries have got to go! To solve real world problems we need math working in cooperation with science, social science and even the ARTS!
Kristin Flaming
Barbara Hopkins
Agreed! Funny about the arts...I am a chemist, potter, and metalsmith! When I tried to overhaul our arts curriculum as the District Curriculum Lead...I had so much push-back from Art teachers! Then when the budget cuts due to lower enrollment ensued...they pushed with how they use science and mathematics within the arts! So it took a bit longer...but crossing the silos is so important in all of our work! Check out my video with the ballet dancer now in the BioFabrication industry!
Kristin Flaming
Kristin Flaming
Valdosta State University Department of Psychological Sciences
Hi Barbara, we do have a few middle school teachers that started the boot camp model in STEM/STEAM and other similar elective courses. I worked with them to tie in the the Arts & Humanities through the visual displays of their posters. We also have a new partner in NY at a technology school that has a program for high school students working toward a nursing degree that take dual enrollment courses through the technology school. When the students are done at the technology school they will complete their CNA work and move on to a nursing program.
Kristin Flaming
Rebecca Lowe
Hello, I am really excited to learn about your work through this showcase. I am part of a team that is engaging in similar efforts to promote introductory data exploration connected to social justice as a means to broadening interest and participation of students from groups that have been historically underrepresented in STEM. I will be definitely working to become more familiar with the work you are doing and the resources that have been created by your group. If you want to learn more about our project efforts we have a video in the showcase as well: https://stemforall2022.videohall.com/presentati...
Kristin Flaming
Kristin Flaming
Valdosta State University Department of Psychological Sciences
Thank you Rebecca! Feel free to email me, kristin.flaming@gmail.com, to gain access to our free faculty resources that are password protected. Some of our early publications examine learning experiences and outcomes in URM vs Non-URM. While URM students considered the material more difficult than non-URM students, URM students demonstrated similar levels of increased confidence in applied skills and interest in follow up courses as non-URM students. URM students were found to be twice as likely as nonURM students to report that their interest in conducting research increased.
Dierker, L., Alexander, J., Cooper, J., Selya, A., Rose, J. Dasgupta, N. (2016) Engaging diverse students in statistical inquiry: A comparison of learning experiences and outcomes of under-represented and non-underrepresented students enrolled in a multidisciplinary project-based statistics course, International Journal for the Scholarship of Teaching and Learning, 10(1), 1-9.
Kristin Flaming
Lelli Van Den Einde
How have you broaden participation in your program? What have been some of the barriers or challenges your project has faced.
I love that you are letting students come in and tell them it is ok to question things, it is ok to follow your passion, it is ok to fail.
Kristin Flaming
Lisa Dierker
Walter Crowell University Professor of Social Sciences
Hi Lelli. Liberal arts colleges, large state universities, regional colleges/universities, medical schools, community colleges, and high schools have all successfully implemented the model. We have also published work showing that the project-based model attracts more underrepresented students than a traditional math statistics course...
Dierker, L. ., Cooper, J. ., Selya, A. ., Alexander, J. ., & Rose, J. . (2015). Evaluating access: Comparing enrollment patterns in traditional versus multidisciplinary, project-based introductory statistics courses. Journal of Interdisciplinary Studies in Education, 4(1), 22–37. Retrieved from https://www.ojed.org/index.php/jise/article/view/1599
and that the project-based curriculum attracts higher rates of women and underrepresented students compared to an introductory programming course.
Cooper, J., & Dierker, L. (2017). Increasing exposure to programming: A comparison of demographic characteristics of students enrolled in introductory computer science programming courses vs. a multidisciplinary data analysis course. International Research in Higher Education, 2(1), 92-100. DOI: 10.5430/irhe.v2n1p92
Great question about the barriers. The single greatest barrier is that instructors who teach statistics and research methods courses often do not have the skills needed to support students in doing authentic research. This is particularly true in departments of mathematics where large numbers of students encounter statistics. Though we support many different statistical software platforms, it is important that students learn a platform that helps them answer their research question and apply their new knowledge. We run faculty workshops helping to support this effort.
Kristin Flaming
Daniel McGarvey
Hi there Lisa. Your comment here really stood out to me: "The single greatest barrier is that instructors who teach statistics and research methods courses often do not have the skills needed to support students in doing authentic research". That has been my experience as well, and it's why I decided to drop the traditional stats courses in my graduate program (Environmental Studies Masters program at Virginia Commonwealth University) and replace them with in-house versions. Our students tend to be overwhelmed and disappointed by the mechanical presentation they typically get from a Statistics professor, where the class may include students from 20 different departments. Now, all of our grad students take an initial "Environmental Data Literacy" class that does dual duty as introductory stats and R programming. We make things very conceptual and do our best to make the R content feel more like a puzzle than programming per se. I'm quite pleased at the initial success with this approach. But there remains at least one fundament component that seems to be a stumbling block for many of our students: stats will never make sense, no matter how well its taught, if a student does not have a somewhat intuitive grasp of probability. For practical purposes, just about any statistical procedure can be explained with simple drawings of probability distributions. But if those distributions themselves seem scary and students tune out, things become much more difficult. I wonder if you've struggled with this (granted, your project is dealing with much younger students than my grad students) and if so, what sorts of solutions you've come up with?
Kristin Flaming
Lisa Dierker
Walter Crowell University Professor of Social Sciences
Daniel, Thanks so much for your post. I love what you describe. Without question statistics needs to be integrated with the statistical platform. We need to get real tools like R into students hands much earlier than we are. Focusing on the conceptual and on the questions students care about within their discipline or their lives is also critical to creating empowerment. Great that you are embedding it within the discipline. As for statistics making sense, that is such a great topic of discussion. From my own experience of taking many statistics classes as a grad student and post doc, it is the general explaining alone that was the barrier to my understanding. When I look at what I know and ask myself how I got here, the answer is not that instructor X explained it to me. All of the instructors drown me in details that helped me see the trees and miss the forest. Understanding came from watching data behave over and over and over again. I knew the definition of multicollinearity, but I did not understand it until my multivariate models were not converging and I had to start descriptively exploring what was going on with the variables that were providing strange estimates. Then I could see in the data that I had two variables practically measuring the same thing. Statistical power is another good example. I could define it for you, but until I started getting small p values within large data sets and then seeing that the differences between groups were not all that interesting, the definition did not really make sense to me. It is in those moments that I remind students about probability and how large/small numbers affect how large the differences need to be for something to be considered statistically significant. I did not even get the relevance of the coin flip concept in the work I was doing until I was a post doc! Crazy I know but I think it demonstrates that understanding comes in application of the tools and explanations that are given just in time and in the context of real data. We need instructors to guide students and react to what the data is doing and what it is showing. It isn't magic, but I find it gets students there much more quickly. I am also going to drop a comment on your video because I think marrying what your group is doing (getting students out in the world doing science and collecting data) and what we are doing (teaching data analysis and applied statistics in the context of a question) would be a very powerful combination.
Kristin Flaming
Tichina Ward-Pratt
Educator
Great project. I appreciate the project's focus to target underrepresented communities. You mentioned that “the single greatest barrier is that instructors who teach statistics and research methods courses often do not have the skills needed to support students in doing authentic research.”
How might you all tackle this barrier while also utilizing the assets of the school, communities and students that you serve?
Kristin Flaming
Lisa Dierker
Walter Crowell University Professor of Social Sciences
Your suggestions on this front are warmly welcomed! Resources in the schools are limited and not surprisingly instructors have many competing demands on their time. We use NSF support to run both online and in person workshops that take everyone exactly where they are at and provide the kind of individualized support that allows instructors to begin to fill in gaps they may have in their skill set. Still, learning takes time and whenever possible we try to implement a apprenticeship model where instructors can learn along with students in the classroom setting.
Kristin Flaming
Tichina Ward-Pratt
Joan Ferrini-Mundy
University President
This is very interesting! And good to see the results in the Dierker et al. study comparing post-engagement confidence and interest of URM and non-URM students. Are there efforts here to also look at understanding and capabilities with the tools and techniques to which the students are introduced as they work to solve their "passion-driven" problems? And, I am interested in whether you have a summary (perhaps it is essentially the content in the virtual modules) of the tools and techniques that the students most commonly need.
Kristin Flaming
Kristin Flaming
Valdosta State University Department of Psychological Sciences
Hi Joan,
As Lisa mentioned the eBook is the best way to see the course topics. Since each instructor takes their own approach with the model they have the flexibility to remove content as well as add content that they believe is important for their students. For example, some remove the confounding chapter and add in additional types of factorial ANOVA's.
The Guidelines for Assessment and Instruction in Statistics Education (GAISE) college report was used when this model was conceptualized https://www.amstat.org/education/guidelines-for-assessment-and-instruction-in-statistics-education-(gaise)-reports.
In terms of the data we collect, our focus is on the student attitudes and less on testing their knowledge of the content. In the class many of our partners use M.C. quizzes to assess their learning of the lecture video, then applied M.C. questions at the end of a chapter and end of the unit. The final exam used by many requires the students to analyze a dataset new to them and answer applied M.C. questions.
When I compare my students abilities at the end of a course to my students that I taught the more traditional calculation and canned exercises approach I find the project-based students can see the use and interpret statistics and research outside of the classroom setting. It has created a pipeline of students entering into faculty labs as sophomore's instead of junior's and senior's. I have many students that will send me an email or stop by my office to tell me how their experience in a Passion-Driven Statistics classroom developed many transferable skills for future classes and in their workplace.
Kristin Flaming
Lisa Dierker
Walter Crowell University Professor of Social Sciences
Thanks so much for your interest in the model! All instructors using the curriculum take their own approach to exams and assessment of understanding and capabilities. I can say though that URM students in the liberal arts environment that I teach in perform statistically similarly on exams and applied code-based assessments to non-URM students. The best summary of topic and tools in available in our e-book.
Here is the online version. https://bit.ly/PDSe-book
Here is a pdf version of it http://bit.ly/Passion-DrivenStatistics
We present material as tools and skills they will put on their tool box and then provide the opportunity to use them flexibly in completing their project.
Kristin Flaming
Maia Punksungka
This is such a great way to expose younger students to statistics and statistical software programs used at the college-level and in research-related fields. Of the projects that your students did, which project was most memorable? And how did the project helped build their understanding of their own social world?
Kristin Flaming
Lisa Dierker
Walter Crowell University Professor of Social Sciences
A very popular data set has been AddHealth. With this data students have gravitated toward questions about religion, depression, school connectedness, etc. We find that students pick something very personal. One student grew up without a father and wanted to learn about mental health outcomes based on the presence of a father in ones life. Another student's mom told her that religion protects us from depression and so that student explored the relationship between religion and depression in her project to see if the hypothesis could be supported. This model is incredibly useful for getting students thinking about socially important topics and framing the conversation with them around empirical data!
Kristin Flaming
Ambika Silva
I love that you focus their projects on what they're interested in. It reminds me of the Statistcs Enquiry cycle where you start with a problem or question then plan your study, gather data, then go to analysis. Often times we just give our students data to analyze without thinking of the reason we're investigating in the first place!
Kristin Flaming
Lisa Dierker
Kristin Flaming
Valdosta State University Department of Psychological Sciences
Hi Ambika,
Yes we essentially are doing that cycle without gathering data instead we use large, real, archival data sets. We find that having this context of their project to work through each statistical concept and analysis allows the student a frame of reference throughout the semester. Then after they leave the classroom the students report that they use their project to refer back to when they are reading research articles or working on a research project.
We all have had the experience of learning more when we are using the skills rather than canned projects whether it is in a statistics class or some other content course. This course allows that immersion into the research project to gain those real world skills.
Kristin Flaming
Joi Spencer
Interim Dean and Professor of Mathematics Education
Hello Passion Driven Statistics Team!
I love that you are passionate about getting statistics as well as the tools dissect and make sense of statistics to young people, to those kids who rarely get access to stats, and also to people who teach and want to improve their teaching of statistics. I also love that your resources are free.
Can you share information on how students are chosen to be part of the summer program. I see that you mentioned Gear-Up. Are there academic requirements or is this offered to all? Many times students who are not performing at a particular level do not get access to important extra-curricular experiences. Of course, it is these very experiences that have the potential to spark interest and engagement and potentially improve achievement.
Can you share a bit of what you have learned about what kinds of understanding kids bring with them? What do they seem to resonate and make sense of quickly? What is more of a challenge? Do you find that the use of R impedes students? I am also curious about students prior experiences with programming. Do you find that students have some programming skills already or is it all fairly new for them?
In considering datasets- do you find that there are things your students are interested in, but you cannot locate datasets that address the topics? I apologize for the abundance of questions. Statistics and the teaching of statistics is a passion of mine as well.
Kristin Flaming
Lisa Dierker
Walter Crowell University Professor of Social Sciences
Hi Joi. To date, the Gear Up teams have handled recruitment for the summer programs and everyone who was interested was able to participate. No academic requirements and no prior experience needed! We even had some students who were newly learning English. Since we have a low student-teacher ratio, we are able to provide the kind of one-on-one support that is needed.
What the kids bring with them that is so valuable is curiosity. Our curriculum capitalizes on this and students begin to drive their own work with our role being simply as a mentor and guide. Students also have an intuitive sense of how to describe data. The ideas behind choosing and using inferential statistics are more challenging.
The use of R and other statistical platforms is actually a window into statistical thinking. With the right kind of support and a very applied approach students learn this very quickly. The vast majority of students have never done any programming in the past even at the college level. This is one of the most valuable aspects of the curriculum, that is, engaging students in applied programming experiences. This is so important early and often in ones educational journey.
The data sets we use are large and rich (e.g. the National Longitudinal Study of Adolescent Health) and students have no trouble developing questions that they are interested in pursuing. Given that students are new to data analyses, we do not have them locate their own data sets, but instead provide them with options.
Thanks so much for all of these great questions. We are excited that this curriculum has been used across so many different educational contexts. If you are starting students off with real world data, having them choose the research questions to pursue, and everything you teach them is in support of helping them to answer those questions, you are doing Passion-Driven Statistics!
Kristin Flaming
Kristin Flaming
Valdosta State University Department of Psychological Sciences
Joi to add on to what Lisa said...
You mentioned the students that are not performing need the extra-curricular experiences. I am not sure how familiar you are with Gear-Up. That program is implemented when a school has a minimum of 50% of a school's student body must be enrolled in the federal free and reduced-price lunch (FRL) program. A person working for Gear-Up is placed in the school to work with all the students not just those on the FRL. When the Gear-Up personnel recruits for the summer programs it is offered to all students not just those on the FRL. For the summer program we had many students that were high performers without financial struggles based on what they reported their parents did for work. However, the other half when describing their research topics or they would bring up in some way throughout the week I would guess did not get access to many extra-curricular without the Gear-Up program.
Most of our instructors offer either one or just a few data sets for students to choose from and when we do the summer boot camp we only offer one data set with younger students. We do look for new data sets to try out with students but we are not finding specific data sets for each students because we use such rich data sets that have a diverse number of variables. For example, AddHealth that Lisa mentioned has over 2300 variables that are from over 20 major topics.
In terms of software, how we lessen the learning curve is by have engaging well developed lecture videos students watch prior to class that show step by step the software with an example. Then in class we provide generic code that they then edit just the necessary parts. As an instructor, each day I work through a project of my own showing a step then having the students do the same step. This back and forth of me demonstrating, discussion and the students following along with their project reduces the anxiety of learning a statistical software program. I use SAS on demand, free cloud based, because I find it easier for students to learn the R, but even with R we reduce the learning curve.
Kristin Flaming
Deirdre Smeltzer
This looks like an excellent program! Empowering students by tapping into their passion is fantastic! I am inspired by the way that both this project and the StatPREP project put real data and authentic student engagement at the center of your pedagogical approaches.
Kristin Flaming
Kristin Flaming
Valdosta State University Department of Psychological Sciences
Thank you for your support of our project.
Kristin Flaming
Cynthia Stenger
This looks like an exciting program. I believe UR is a key to student buy in, and the passion part is what drives it. I encourage students in bioinformatics research to pick a topic (disease or disorder) they are passionate (possibly due to a family members diagnosis) and this helps drive them to dig into the research.
I also love that you used the GAISE to design your course. I have used the GAISE successfully for 4 years as the basis of course organization in 2 courses: statistics for the elementary teacher and a graduate class of statistics for high school teachers.
Kristin Flaming
Kristin Flaming
Valdosta State University Department of Psychological Sciences
Do your bioinformatics students use archival data or gather data?
I am sure you experience challenging conversations in the classroom with students choosing diagnosis of someone they know. What successful strategies have you found to turn the conversation to positive or productive?
That is great you have found success with the GAISE recommendations. We have found these work even more so with the non-statistics major. I really enjoy when these types of students have a positive attitude change toward statistics and research rather than just getting through the course.
Kristin Flaming
Josephine Louie
Hi Passion-Driven Statistics Team,
Your work is wonderful -- we share your passion! We also share overlapping approaches -- our video last year (https://stemforall2021.videohall.com/presentati...) describes the social justice-focused statistics modules we have developed and tested for high school students. Can you share more about how high schools have used your materials? Have they been in AP or non-AP classes, or both, and how have teachers helped to implement your materials? Have you provided teachers with PD? Have teachers been able to support students in using R or SAS or JMP or... ? How have you helped high school teachers and students become familiar with some of the large public datasets that you use?
Kristin Flaming
Kristin Flaming
Valdosta State University Department of Psychological Sciences
We have a condensed version of our model we call the boot camp model. It is essentially 15 hours of contact with the project, that can be all in class or some in class and then homework.
They choose two variables they are interested in learning if there is a relationship from a large, real world, archival dataset. For example, like AddHealth https://addhealth.cpc.unc.edu/ We have conversations about the research process, their data, software, etc. We take a just in time teaching of only what you need to know in a flipped classroom.
Next we run frequency tables, sort each variable by the other in frequency tables, univariate and bivariate graphs to allow the students to visualize and understand in percentages the relationship. We typically use SAS on demand code based, free, cloud based program but have also use R and other software.
We then add a third variable to understand the relationship in the subsamples of the third variable.
Gradually while exploring the data we take breaks to work on developing a research poster. The background is just why they chose the two variables, then method we give them some generic that they edit for their variables. Next they start doing the results and uses graphics that help tell their story.
Throughout the process we support them one-on-one and have group conversations to have the students tell the story their data is telling.
This culminates into a research poster presentation session much like you would see at a research conference. We invite in people from the university and community to explore the projects so the students have a new audience.
We have done this boot camp as a week intensive course or at the end of a course to wrap it up. If we have more time then we add in inferential statistics, doing a review of the literature, etc. depending on how much time we have with the students.
Josephine Louie
Thank you for this detailed response-- it is very helpful to get this view into your boot camp model!
Further posting is closed as the event has ended.