


- Annette Schloss
- Presenter’s NSFRESOURCECENTERS
- University of New Hampshire, University of Southern Maine, Windham High School (ME)
- Jeff Beaudry
- https://sites.google.com/a/maine.edu/visualliteracy20/home
- Associate Professor
- Presenter’s NSFRESOURCECENTERS
- University of Southern Maine
- Eric Hanson
- STEM Education Specialist
- Presenter’s NSFRESOURCECENTERS
- The World Bank, Windham-Raymond School District
Cyber-Infrastructure Digital Education & Research (CIDER)
NSF Awards: 1135545
2015 (see original presentation & discussion)
Grades 9-12
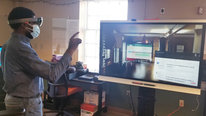
For much of the northern United States, the months surrounding the winter solstice are a time of increased darkness, low temperatures, and frozen landscapes. Each year, the ubiquitous white ice crystals that blanket regions of the north go uninvestigated. Instead of hunkering down indoors with their classes, however, teachers can take advantage of a plethora of learning opportunities outdoors. We developed multiple activities to engage students in the scientific process of collecting, analyzing, and interpreting snow data. This video describes two outdoor activities in which students learn about the insulative properties of snow cover and participate in a citizen-science network to collect scientific data on snow reflectivity (albedo). As part of the Cyber-Infrastructure Digital Education & Research (CIDER) project, we experimented with students’ recording and further exploring the data directly using weather-wrapped and outdoor WiFi-enabled iPads.
The Thermal Index of Snow and Measuring Snow Reflectivity in a Citizen Science Network investigations integrate scientific practices, crosscutting concepts, and disciplinary core ideas as described in the Next Generation Science Standards. Students engage in the scientific practice of Analyzing and Interpreting Data and explore the crosscutting concepts of Patterns and Cause and Effect. Disciplinary core ideas addressed include ESS2.C: the roles of water in Earth’s surface processes and ESS2.D: weather and climate. The creation and analysis of bar graphs and xy scatterplots also directly address the Common Core State Standards (NGAC and CCSSO 2010) as well.
Related Content for Sampling in the Snow: If All You Have is Winter, Use It!
-
 2018Project TACTIC
Todd Lash
-
 2020The Rutgers CS Teaching & Learning Collaboratory
Cynthia Blitz
-
 2018Increasing Computing Participation through Debugging Puzzles
Michael Lee
-
 2019Teaching Accessibility to Broaden Participation
Richard Ladner
-
 2016The ASSISTments TestBed
Neil Heffernan
-
 2021Virtual Citizen Science Expo
Nicole Colston
-
 2015Engaging Students in CS through Modeling and Simulation
Irene Lee
-
 2016Including Students with Learning Differences in CS
Sarah Wille
Brian Drayton
I enjoyed this!
I am curious what sort of analysis/interpretation the students do? There have been citizen science projects I’ve seen, in which the data collectors don’t do a lot of the sense-making, nor even worry about interesting anomalies in their data — it all goes off to the Big Database someplace. Do your students get to work with the large data set, as well as their own? Are you building a longitudinal data set for your HS? Lots of fun possibilities!
Eric Hanson
STEM Education Specialist
Brian- Happy to hear you enjoyed our video! In this activity the students are collecting data that serves dual purpose. In isolation, the data can be used to make determinations on snows’ insulative value and reflectivity at the local level. However, our students are also participating in a nationwide citizen science initiative called the Community Collaborative Rain, Hail & Snow Network- http://www.cocorahs-albedo.org.
This data is used by climate scientists working at the National Center for Atmospheric Research in Boulder Colorado. This database provides students an opportunity to explore and analyze datasets that range both geographically and temporally. If you’re interested in actual assessments or activities check out this link to access a few samples here- http://www.nsta.org/highschool/connections.aspx
You can find them under the March 2015 headline. Look for Sampling in the Snow!
Tammy Pirmann
K-12 Coordinator
Do the students do the data analysis themselves? What tool(s) are they using?
Eric Hanson
STEM Education Specialist
Tammy, great questions! Students collect the data using the “snow measurement kits” and the data analysis is done by students. The “number crunching” is formulaic and our high school students don’t have too much trouble working through the analysis. Internally, students use a shared google excel document to access the data and we created a few worksheets and classroom activities that require students to dig a bit deeper into their data sets. You can check out a few of these activities here- http://www.nsta.org/highschool/connections.aspx. You can find them under the March 2015 headline. Look for Sampling in the Snow!
Amie Patchen
What a great idea for outdoor science in the winter! I am also curious about what your students do with the data and how the projects are integrated with the rest of the science curriculum. How long are the projects? Are they complete stand-alone units or interspersed with other science topics?
Eric Hanson
STEM Education Specialist
Amie, Thanks for commenting on our video! These activities are embedded in a larger Winter Ecology unit as part of an Environmental Science course curriculum. Here’s a link to the article that describes each of the activities and how they fit into the larger k-12 STEM curriculum picture – https://dl.dropboxusercontent.com/u/75998099/Sa...
Beth Sanzenbacher
Middle Science Instructional Leader
As a teacher based in Chicago I have a real appreciation of outdoor actives using snow! I love the use of data in this project that students can use collected data for their own projects but that it also connects to something larger – key for intruding and getting involved with the scientific community.
I have two questions. First, it was stated what outdoor wifi was installed and used in this project. I could see this as a hinderance to scaling this project. Are there offline ways to accomplish the same goals?
The model of a workshop with educators to create and develop cyberlearning tools and interventions is inspired! Can you talk a bit about the benefits and challenges you have encountered using this model?
Annette Schloss
Hi Beth,
our CIDER project explored ways to augment learning in outdoor educational settings with mobile technologies. Teachers and students can do the field work, collect data, and do analysis in traditional ways. If they want to contribute to the snow network, they can post their data later from any internet-connected computer. Eric can share a PDF of the curriculum if you want to see or use it!
Beth Sanzenbacher
Middle Science Instructional Leader
I would love to have a PDF of the curriculum! Thank you!
I’m curious, do you think students learned more or where more engaged using the mobile technologies than by more traditional data collection techniques?
Eric Hanson
STEM Education Specialist
Beth- Here is a link to the 4-pager curriculum overview- https://dl.dropboxusercontent.com/u/75998099/Sa...
Additional materials can be found here- http://www.nsta.org/highschool/connections.aspx. You can find them under the March 2015 headline. Look for Sampling in the Snow!
Now to your question of student engagement! Students love excuses to use technology in science and the outdoor wifi and use of tablets certainly provided students another opportunity to do this. That said, the lessons we created can be performed with or without the tech. Qualitatively, I have no doubt that the outdoor wifi-enabled environment enriched these lessons and outdoor explorations. The value add here is that students were able to collect and analyze data in real-time with 21st century tools.
Further posting is closed as the event has ended.