- Gillian Puttick
- Principal Investigator
- Presenter’s NSFRESOURCECENTERS
- TERC
- Jackie Barnes
- Postdoctoral Researcher
- Presenter’s NSFRESOURCECENTERS
- Northeastern University
- Michael Cassidy
- Research and Evaluation Associate
- Presenter’s NSFRESOURCECENTERS
- TERC
- Abe Drayton
- Sr. Research Associate
- Presenter’s NSFRESOURCECENTERS
- TERC
- Casper Harteveld
- http://www.northeastern.edu/casperharteveld/
- Assistant Professor
- Presenter’s NSFRESOURCECENTERS
- Northeastern University
- Amy Hoover
- http://amykhoover.com
- Postdoctoral Researcher
- Presenter’s NSFRESOURCECENTERS
- Northeastern University
- Gillian Smith
- Presenter’s NSFRESOURCECENTERS
- Northeastern University
- Eli Tucker-Raymond
- https://www.terc.edu/display/Staff/Eli+Tucker-Raymond
- Research Scientist
- Presenter’s NSFRESOURCECENTERS
- TERC
Choice Presenters’
Choice
Research on the Development of Computational and Systems Thinking in Middle S...
NSF Awards: 1542954
2017 (see original presentation & discussion)
Grades 6-8
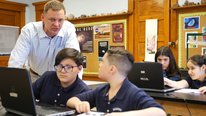
The Building Systems from Scratch project is using multiple cycles of design-based research to integrate systems and computational thinking into middle school learning about climate science by interweaving game design and climate science learning. Students explore a systems and socio-ecological approach to learning about intersections between computation and climate change dynamics. The project is based on the idea that when young people build games, they construct knowledge at the same time. We are developing and testing the idea that students learn systems thinking and climate science better by building games than by direct instruction or student inquiry alone. We are also developing and testing the learning environment in which students build games. It includes students as knowledge producers, collaborative structures of pair programming, developing classroom networks of distributed expertise, art studio-inspired critique sessions, and a focus on game design as consisting of three related elements, reality, meaning, and play.
Related Content for Building systems from Scratch
-
 2015Innovate to Mitigate
Gillian Puttick
-
 2021Wearable Learning Cloud Platform (WLCP)
IVON ARROYO
-
 2021Code Crafters
Jordan Graves
-
 2022Innovate to Mitigate: Environmental Innovation Challenges
Gillian Puttick
-
 2017The Climate Lab: schools as satellite field stations
Brian Drayton
-
 2019STEM for English Language Learners with Lehman College-NWHS
Serigne Gningue
-
 2021Building Student Computational Thinking using Online Gaming
Elizabeth Adams
-
 2018Interactive Simulation-based Learning for Earth Science
Michelle Zhu


Jodi Asbell-Clarke
Hi Gilly - great video! I see you are using a screen/camera capture software (e.g. ScreenFlow?). I hadn't realized that. Are you analyzing those videos? how?
Eli Tucker-Raymond
Research Scientist
Hi Jodi,
We are still thinking about ways to use them as part of integrative analysis. right now, we use them in two main ways: First, as the main source of data for interaction analysis between the programming pairs and their game. The interaction analysis has focused on power dynamics in pair programming (this is nascent analysis), the kinds of systems thinking that the students are doing around climate change, and the ways in which students are spontaneously participating in critiquing each others games and offering/soliciting help/advice. Second, as qualitative analysis of student design choices along three lines: player interactions, mitigation topic, and the metagame (e.g. narrative, instructions). These are just our initial uses of the data. We also expect that the screen captures will help corroborate more quantitative looks at computational thinking and design choices and that we will delve deeper into micro-interactions between partners.
Kip Glazer
Dean of Students
As a person who has written about game design as a teaching tool, I absolutely love this project! Do you exclusively use Scratch? Or do you allow students to use other game creation tools? And how do you know that the activities are addressing the content standards? What assessment tool do you use to demonstrate that the students are learning what they need to learn?
Eli Tucker-Raymond
Research Scientist
Hi Kip,
We exclusively use Scratch because it is free and relatively accessible. There are other platforms that might be better suited to building games, but we don't want to overload teachers with having to learn multiple systems. Some students want to use Python or whatever programming language they are learning, but they still end up creating some pretty good games in Scratch and serve as inspiration/ideas for others. I think that leads to your other questions. We intentionally created a curriculum that identified content and practice standards in both NGSS and Massachusetts's standards on science and engineering released in 2016. We have created pre/post assessments that include items on climate systems content and computational thinking, as well as surveys that include attitude and motivation items. We have drawn questions from other, validated instruments as well as vetted our questions with content experts in climate science and in computer science. We also have loads of data from close participant observation of multiple classrooms and 3 groups of focal pairs in each classroom. But I guess, when you say "students are learning what they need to learn," what are you specifically referring to? "Climate systems science?" "Computational thinking?" "21st century skills?" "Responsibility for the earth?" Or, what else?
Barbara Ericson
Are you familiar with Bootstrap? They also use game design but to improve algebra knowledge.
Eli Tucker-Raymond
Research Scientist
Hi Barbara, that's cool stuff they have going on over there. What do you think is good about them that we could learn from? We mainly do research on student and teacher learning, the design of the curriculum is part of our research. Do you think there is something particular about their design that could enhance the experience of the teachers and young people in our project?
Barbara Ericson
They also manly do teacher professional development and create curriculum. I think it would certainly be worth talking to them to see what you might learn from them. See http://www.bootstrapworld.org/community/index.s... I would talk to Emmanuel Schanzer.
Eli Tucker-Raymond
Ben Sayler
Professor, Physical Science and Mathematics
Great video indeed! When you say that students research climate change and then create a game, could you provide more details about how they research climate change? Is their research guided? I'm also curious how much they already know about climate and climate change before starting and how much, if anything, they know about Scratch before they begin. And finally, how much class time is devoted to the combination of their research and game design?
Eli Tucker-Raymond
Research Scientist
Hi Ben,
Students at different schools have had different experiences with climate and weather and climate change systems. But teachers are able to adapt the curriculum to their needs. In all about 5-7 days of class time is spent at the beginning learning about climate systems and climate change. Teachers do this in different ways. Originally, the goal of the project was to have students do all their learning about climate science while making their games and we provided access to various materials through a learning library, but we realized we needed to be more explicit about different components of systems (as opposed to simple causal chains) so we front loaded some of the content. After those first few days students begin learning what makes a good game and begin forays into the programming language through debugging activities. About the 11th day the students begin designing their games and they usually take about 10 class periods with some working on their games at home. That said, students come with all types of familiarity with Scratch and/or programming, but everyone is able to make some type of game. You can see some of them at buildingsystems.terc.edu
Gillian Puttick
Principal Investigator
Hi Ben -
The url where you can find games is external-wiki.terc.edu/display/SCRATCH.
Jennie Lyons
Computer Science Specialist
Looks like a natural to help students internalize the content. I am curious about how the measurement of the students' "increased in efficacy in integrating computational thinking into science" was made.
I tried to access the games, but the link above produced an error. I'd love to see the results!
Michael Cassidy
Research and Evaluation Associate
Hi Jennie,
Thank you for your post and interest in our project
For the website, please try buildingsystems.terc.edu
In response to your question about our measurement to efficacy in computational thinking, our findings are suggested from our pre/post student survey. Our survey measures student self-efficacy, attitudes, and persistence in relation to game design, science, computing, and climate change.
Gillian Puttick
Principal Investigator
Hi Jenny
Try https://www.external-wiki.terc.edu/display/scratch
Ben Sayler
Professor, Physical Science and Mathematics
I'd love to see the results too -- and know more about your research design. Thanks!
Eli Tucker-Raymond
Research Scientist
Hi Ben,
We are using Design-Based Research to iterate on and refine the model. We are currently in Year 2, but about the fourth iteration of the model, as our cooperating teachers have implemented at different times of year, we have been able to take information from our observations and tweak what we ask students to do. We use mixed methods to collect and analyze data. We use repeated analysis of variance on pre/post attitude/efficacy measurements as Mike outlined above as well as pre/post climate systems and computational thinking items. Qualitatively, we have selected one section from each of the teachers to observe. We select three focal pairs from classrooms to follow with screen capture/camera software as well as video tape whole class discussions and take fieldnotes daily. Teachers also keep implementation logs. Our research questions are related to the conjecture map (See Sandoval, 2014 in JLS) we iterate on as we refine the model. However, they are related to teacher take up, student learning, and the affordances and constraints of the participant structures, task structures, discourse practices, and tools and materials. For instance, we think students-as-experts positions students in productive and generative ways in classrooms and so we are studying how students seek each other out for help or spontaneously give feedback and help within the structure of our curriculum. Results are ongoing. Next year, we hope to conduct a quasi-experimental comparative study with about 15 8th grade teachers (60 classrooms).
Ben Sayler
Jenna Welsh
Great video. This is such an innovative project!
Gillian Puttick
Principal Investigator
Thank you Jenna. It has been a privilege to work with extremely enthusiastic teachers, and engaged students. We're learning a great deal!
Bill Swift
Dear Gillian:
This sounds like an amazing program and great to hear it is going to be used across Boston. I work with the PBS News Hour as the Coordinating Producer for their STEM Student Reporting Labs. I think we experience a similar effect to your program.
We are teaching kids how to produce quality journalistic video news stories with a STEM focus. Good videos are a wonderful testament to our program, but it is really the skills and curiosity that are stoked in the students as they have to go through the process of finding an idea creating their story, researching and vetting their science, and then trying to film it and put it all together into a great story.
Like your program, where if the students game or app they code doesn't turn out to be the best, or their interaction with climate science is not perfect, they are learning so much from the actual coding experience and trying to work with climate science, they are so much more aware and engaged when they come out the other end. We find the same thing, thanks to our fabulous testing team that does the follow up research for NSF. We see our students in the STEM program are more engaged with STEM concepts and have better STEM awareness and are more interested in News and other stories they see, because they know how those stories were made, since they have tried to do it themselves.
Keep up the great work.
Gillian Puttick
Principal Investigator
Thank you, Bill.
Yes, our data (assessments and interviews) show that students not only benefit from their coding experience, but that they also know a great deal more than they are able to - or choose to - include in their final games. If one thinks of student representations of aspects of climate science in their games as a form of modeling, they make careful choices of what science they want to include. Creating a game to teach others is a complex task, and they are juggling the cognitive load of learning to program, learning the climate science, and conveying a message, all while trying to make an engaging experience for the player. Professional designers of educational games struggle with this complex task!
Further posting is closed as the event has ended.