

- Clara Cogswell
- https://www.cuahsi.org/about/our-team
- Community Support Hydrologist
- Presenter’s NSFRESOURCECENTERS
- CUAHSI
- Austin Raney
- https://www.cuahsi.org/about/our-team
- Hydrologist
- Presenter’s NSFRESOURCECENTERS
- CUAHSI
CUAHSI
NSF Awards: 1148453
2022 (see original presentation & discussion)
Undergraduate, Graduate
The Consortium of Universities for the Advancement of Hydrologic Science (CUAHSI) is an NSF funded 503(c) non-profit with the goal of providing key infrastructure to the water science community. We provide cloud computing, repository, and other essential services, to help researchers at all stages of their careers fulfill their data plans and adhere to F.A.I.R. data standards.
Science, Computer Science, Research / Evaluation
CUAHSI
Directorate for Computer and Information Science and Engineering (CISE)
Related Content for CUAHSI & the Data Lifecycle: CyberInfrastructure for Water
-
 2019GLOBE Mission EARTH: Inspiring Tomorrow's STEM Professionals
Sara Mierzwiak
-
 2021GLOBE Mission EARTH: GLOBE in the Time of COVID
Sara Mierzwiak
-
 2017THE CROWD & THE CLOUD trailer
Geoff Haines-Stiles
-
 2022Science Education in the New Normal: Role of Citizen Science
Russanne Low
-
 2022Integrating Environmental Restoration with Computer Science
Dr. Lauren Birney
-
 2022Engaging High School Students in Meteorological Research
Kathleen Hill
-
 2022Value of Authentic Research for All High School Students
Margaret Baguio
-
 2022Meet The GLOBE Program's GLOBE Student Vloggers
Jan Heiderer
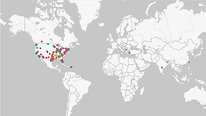
This video has had approximately 119 visits by 73 visitors from 58 unique locations. It has been played 55 times as of 05/2023.
Map reflects activity with this presentation from the 2022 STEM For All Video Showcase website, as well as the STEM For All Multiplex website. 
Based on periodically updated Google Analytics data. This is intended to show usage trends but may not capture all activity from every visitor.
show more
Discussion from the 2022 STEM For All Video Showcase (13 posts)
Clara Cogswell
Community Support Hydrologist
Thank you for watching CUAHSI’s video! CUAHSI is a non-profit that is dedicated to providing shared scientific infrastructure to the water community. Our video highlights how CUAHSI is enabling individuals to create, manage, store and share their data across the data lifecycle, to facilitate ethical and FAIR data stewardship.
We would appreciate community feedback and discussion on the following:
Note: To view the most recent and active NSF grant that funds the continued development and maintenance of HydroShare is 1849458. The grant number specified in the video is the original HydroShare grant.
Amy Alznauer
Lecturer
Good morning everyone!
You did a wonderful job explaining the cycle of data and how your platform enhances the organization, storing, visualizing, and sharing of this data. I imagine the theory behind this digital infrastructure comes from the larger world of data science and has been adapted to the specific world of hydrologic science, but I’d love to hear a little of this origin story and also what aspects of hydrologic science created challenges or opportunities for your project.
I’d also love to hear how this infrastructure has played out in practice. Have you had the chance to measure its impact on research and sharing? And if so, how have you measured this impact?
Clara Cogswell
Community Support Hydrologist
Hi Amy,
Thank you for your insightful comment! CUAHSI is able to track usership over time and we can see that it has grown steadily, with an understandable increase at the start of 2020 as online collaboration spaces became more essential, and virtual instruction resources were needed.
We are also able to monitor how many resources are published, how often those DOIs are resolved, how often the content of resources is downloaded, as well as how many resources are in the public or private state. We are currently working on a functionality that will give users access to data on DOI resolution counts, to increase transparency and demonstrate the high discoverability of published resources with robust metadata. This data indicates how many times a DOI has been resolved from outside of HydroShare, usually resulting from clicks in the references section of a paper.
I hope this answers your question! Let me know if there are any other axis of impact you are interested in!
Amy Alznauer
Lecturer
Thank you Clara! This is wonderful and absolutely answers my question. In case there are people on this forum unfamiliar with the terms here - DOI means Digital Object Identifier (Go here or here for more info).
And check out CUASHI's beautiful website here: https://www.cuahsi.org/
I want to follow up on your first question: "What types of shared infrastructure (i.e. data repositories, online data visualization) have you found to be the most valuable in your field?" and reiterate my own related question. I'd love to hear a little more about how the specific needs/challenges of your field, water science, impacted the implementation of this data sharing infrastructure. And do you see the work you have done here being a model for other fields? How easily would it translate beyond the field of water science?
Andee Rubin
Senior Scientist
Thank you for your video and clear explanation of what can be an esoteric and hard-to-understand topic. My involvement in data stewardship and sharing is more from an educational perspective, as I'm involved in a project where we adapt LTER data for middle and high school students to analyze. I'm particularly interested in the structure of ecological data, as my observation in adapting it for students is that the combination of multiple time series that are often each specific to a particular location can be overwhelming for students. In addition, scientists often take averages over either time or space in their analyses, but sometimes the transition from raw data to averaged data is not well documented. This question may be outside of your domain of expertise - but do you have any thoughts on this question of data structure and/or of how such data can be made accessible to students (by accessibility, I mean "comprehensible," rather than "technically accessible," which you are doing already.)
Along the same lines, I'm also curious about the kind of guidance you provide at the first states of the process: data collection. Do you provide guidance on data structure? Is your guidance specific to hydrology or more general?
Apologies if these questions are slightly orthogonal to your work - but they are burning questions for me and at least related to the important work you are doing!
Amy Alznauer
Lecturer
Just to build on Andee's question and reiterate my own:
What you have done here for water science is impressive and I think Andee's response powerfully demonstrates that people outside your field are interested in your model (have "burning questions" as she urgently put it). Andee asked: "Along the same lines, I'm also curious about the kind of guidance you provide at the first states of the process: data collection. Do you provide guidance on data structure? Is your guidance specific to hydrology or more general?" So maybe answering this more specific question would be a way to get at mine. How might your work in hydrology serve as a model for other fields?
Clara Cogswell
Community Support Hydrologist
Thank you both Andee and Amy for your wonderful questions! I will try to answer both as completely as possible.
Andee to your first question: Do you have any thoughts on this question of data structure and/or of how such data can be made accessible to students: I'm afraid I can only guess as to the age of your students, but I will pass this question to my co-presentor Austin, who may have some insight for you, he will answer below!
As to our data collection guidance it is here: https://www.cuahsi.org/data-services/research-data-management-guide This guide contains suggested data management workflows and a sample data collection plan template, please use it as you see fit, it is not specific to hydrology or water science, and will hopefully be useful to you, and is free for your use.
Amy to answer your previous questions: I'd love to hear a little more about how the specific needs/challenges of your field, water science, impacted the implementation of this data sharing infrastructure. And do you see the work you have done here being a model for other fields? How easily would it translate beyond the field of water science
Our infrastructure implementation had to account for the types of data that water scientists most often deposit, that meant, for example, being able to host the amount of data that would be associated with groundwater and surface water numerical model input and output files. HydroShare is file agnostic for a similar reason, while CUAHSI actually also has a repository specifically for time series data (https://data.cuahsi.org/) with a highly specific upload template, this data can also be stored in hydroshare as an SQlite database.
We have several content type aggregations (Content aggregations) that are automatically ingested and metadata is extracted for users. These aggregations are meant to both account for the needs of the water science community and increase the reusability and discoverability of the data across fields of research. This enables domain specific repositories to create community while enabling cross domain data discovery.
We also had to incorporate the ability for our approved apps such as CUAHSI Jupyter for Water, to interact directly with the data landing page. I hope this is not too long of an answer to your question. I think that the concept of multi data type, domain specific repositories would translate well across research disciplines both for creating internal data sharing standards, and for data discovery. It allows researcher to gather in a central repository and for community standards of metadata and sharing to be agreed upon in practice.
Austin Raney
Hydrologist
Thank you both Andee and Amy for your crafted and thoughtful questions! I will do my best to address the question:
> Do you have any thoughts on this question of data structure and/or of how such data can be made accessible to students?
As you correctly assumed, Andee, this is not specifically my area of expertise (I am a scientific software architect). However, having completed graduate school and served as a teaching assistant, I have culminated thoughts through those experiences.
I think Andee provided an excellent example of difficulties and points of confusion that arise when disseminating multi-dimensional time-series data and spatial / temporal aggregates. As they mentioned, the complexity of these data grow with additional measures and locations. The question that was posed is in regard to data structure and accessibility, I’m taking the question to mean, what are your thoughts on data arrangements (e.g. a single csv file where there are four columns, location, measure time, measure value, measure unit) that maximize student potential understanding without being biased towards a particular learning style? If this does not capture what you all had in mind, please elaborate and I would love to continue the conversation in a different direction!
With that in-mind, I think before considering data structure, its critical to select data formats where tools already exist that provide a plethora of means to interface with that data that hide unnecessary complexity. For example, a format that supports data and aggregation visualizations (i.e. shows the providence of data and visually, how the data is aggregated), programatic access, and ‘tangible’ access (a raw view). Likewise, a format that enables complexity layering is essential, meaning the ability to digest tiers of information based on the learning context without limiting information digestion from a lower tier. Considering how you and others will interface with the data is essential, as well as, providing extensive interfaces for others to absorb the information at the desired tier. By doing so, it enables a chaordic system of learning where the data itself is secondary to the interface in which a person interacts with it. As for structure, structure is then a decision made at the interface layer and becomes a preference of the person learning or exploring the data.
Sadly, I am not aware of a data format that checks all of these boxes. Fortunately, it likely exists and I am just unaware! With my response and the original question in mind, what properties does a data structure needs to be considered accessible to students?
Andee Rubin
Senior Scientist
Thank you, Austin, for your thoughtful response. Just to provide a bit more information, I work with middle and high school students in a project that uses data from the El Yunque rainforest. My role is largely to curate datasets for students to use - and to provide professional development to teachers who will then support students in doing their own inquiry using the data we've provided. The tool we're using at the moment is CODAP (codap.concord.org), which I think is a wonderful tool for middle/high school students - and adults. I still struggle at times, though, to structure the data so that students can ask the questions they find most interesting. The multi-dimensionality, as you so accurately put it, is the issue. I will take a closer look at your resources to see if they help me get some new insights.
Amy Alznauer
Lecturer
Thank you, Clara for you careful response and for the links. I've just now been exploring data (https://data.cuahsi.org/) and marveling at the flexibility and range of the tools you provide.
I spent years teaching the Quantitative Reasoning course at DePaul University, which was basically designed to bring students to a higher comfort and skill level reading and analyzing data. One of the great challenges of that course was having access to data that was as Andee put it structured in such a way that "students could ask the questions they find most interesting." We would have loved having someone curating data for us! CODAP (codap.concord.org) seems like an amazing platform for this sort of course.
From what I can tell, CUASHI mostly operates at a higher level, reaching students specializing in water science fields at an undergrad and graduate school. But it would be fascinating to see partnerships with high schools, where students often are already keenly aware (if only at a general level) of water issues. Has there been any thinking in that direction? Or does that currently go beyond the scope of your work?
Clara Cogswell
Community Support Hydrologist
Hi Amy,
I agree that involvement in water issues at the high school level and even earlier is both impactful and meaningful, and CUAHSI is involved in those activities in more of a tangential way through our position as the coordinating hub for the critical zone collaborative network. The education and outreach committee, which some key CUAHSI staff participate in, makes efforts to create programming for younger students in order to promote engagement in water science at all ages. CUAHSI itself does not develop these programs though. I hope this answers your question! CUAHSI is a very small organization (~15 people), so we don't currently have the bandwidth to organize such programs internally.
Amy Alznauer
Brian Smith
Professor/Associate Dean of Research
It's been fun following the discussion above after watching the video. Clara & Austin, thanks for the overview of your work. I love what you're doing; it still seems complicated for us to find good ways to share data. After seeing the video, I had two questions:
1) How specific is your infrastructure to the water community? It seems helpful for many other data-intensive fields. Are there design features you've built in that help hydrologists do their jobs better?
2) The project description on the video page mentions that you want to help researchers "adhere to F.A.I.R. data standards." I want to make sure I'm right that you mean that data should be findable, accessible, interoperable, and reusable when you say FAIR (?). I think I see how your infrastructure can support these goals. But are there things you've either built into the repository or established as policies to help researchers adopt FAIR data principles?
Clara Cogswell
Community Support Hydrologist
Hi Brian! Thank you for your questions! CUAHSI stands for "the consortium of universities for the advancement of hydrologic science" so our mission is water science driven, but there are parts of our infrastructure (Apps like jupyterhub or the concept of a file agnostic repository that allows users to mint DOIs for data) that could easily be field agnostic if adopted elsewhere. Our repository is open source as well: ( https://github.com/hydroshare/ ) so if someone did take an interest in mirroring part of our infrastructure for their own field, they would be able to do so.
We serve as the coordinating hub for the critical zone collaborative network, who's data needs stretch beyond pure water science, and they use our collaborative infrastructure.
To your second question, you are correct about our use of the F.A.I.R acronym! In our repository we try to build fair standards into the entire workflow, through minimum required metadata for sharing, internal and external discoverability (the discover page and the ability to receive a DOI), and by encouraging the use of interoperable data formats. Our discover page also does not require an account for access, so reviewers and other researchers can easily find data stored in HydroShare without having to create an account.
Once a resource is published and has a DOI, the content, title, and authorship of the resource become immutable, so the resource's citation can be used in any context to lead back to the resource landing page. Here is an example of a published resource by the USGS: https://www.hydroshare.org/resource/615d426f70cc4346875c725b4b8fdc59/ if you care to look at what metadata options are available!
I hope this answers your questions!
Further posting is closed as the event has ended.